Introduction
The properties of shallow acceptor dopants in GaN are important in various device applications requiring p-type doping, such as lasers, light-emitting diodes, photodiodes, junction field-effect transistors, thyristors, bipolar and heterojunction bipolar transistors, and high-voltage junction termination extension in high power devices. The spectroscopic properties and binding energies of many of these acceptors have been characterized only to a limited degree. Ion implantation is a method which permits the easy, controlled introduction of virtually any dopant species (or combination thereof) without complications due to unintentional passivating agents such as H. It is therefore potentially highly useful to survey the properties of potential dopant species. Such a broad survey of 35 elements was performed in pioneering work by Pankove and Hutchby [Reference Pankove and Hutchby1]. However, the implantation doses used were very heavy, in order to overcome the high residual background doping common at that time, and the resulting spectra were therefore quite broad. Also, the annealing temperature used (1050 °C) was significantly lower than that now known to be needed to remove damage effectively and activate dopants effectively in GaN (at least 1300 °C) [Reference Tan, Williams, Zou, Cockayne, Pearton, Zolper and Stall2-Reference Suski, Jun, Leszczynski, Teisseyre, Strite, Rockett, Pelzmann, Kamp and Ebeling4]. Moreover, NH3 was used as the annealing ambient, which is now known to lead to H passivation of various dopants [Reference Nakamura, Iwasa, Senoh and Mukai5], and may have strongly affected the spectra. Also, the photoluminescence (PL) measurements were performed at 77 K, which does not yield the full range of information available at liquid He temperatures, due to thermal delocalization of excitons and thermal phonon broadening. Subsequent PL studies of specific implanted impurities have been reported [Reference Strite, Epperlein, Dommann, Rockett and Broom6,Reference Silkowski, Yeo, Hengehold, Khan, Lei, Evans and Cerny7], but typically employed high dose implantations and sometimes low annealing temperatures. High quality PL spectra typically require low doping levels to avoid the effects of inhomogeneous Stark effect broadening and impurity interactions, which lead to spectral broadening.
The present study aims to demonstrate the feasibility of using low dose implantations of selected impurities into high purity starting material to obtain high quality PL spectra of the resulting localized exciton and impurity states. Annealing is performed under conditions known to recover the damage due to the implantation without degrading the material [Reference Tan, Williams, Zou, Cockayne, Pearton, Zolper and Stall2,Reference Cao, Abernathy, Singh, Pearton, Fu, Sarvepalli, Sekhar, Zolper, Rieger, Han, Drummond, Shul and Wilson3]. This approach also permits us to assess the activation behavior of implanted dopants using optical methods. Electrical characterization of acceptor activation is difficult because of the inefficient ionization of most acceptors in GaN at room temperature. Our initial study employs the most common acceptor dopant, Mg, in addition to two potentially shallower alternative acceptors, Be and C. We find that the latter two impurities do not activate efficiently without a co-implantation under our conditions, but that Mg does. We also investigate the spectroscopic properties of Zn acceptors, using HVPE material doped with Zn during growth.
Experimental Approach
The starting material for the implantations is a 20 µm thick heteroepitaxial GaN layer grown on sapphire(0001) by hydride vapor phase epitaxy (HVPE). This unintentionally doped layer has a net residual doping level of n=5.1×1016 cm−3 and an electron mobility µn = 680 cm2/Vs. The full width at half maximum (FWHM) of the neutral donor-bound exciton (D°,X) peak in the low temperature PL spectrum of this sample is only 1.8 meV, confirming its good quality. Moreover, the only shallow donor-acceptor pair (D°-A°) PL peak in this sample, at 3.27 eV, is only barely detectable in comparison to the 2LO phonon replica of the (D°,X) peak. The residual yellow and red PL bands at 2.2 and 1.6 eV, respectively, are similarly very weak, having maximum heights at least 5000× smaller than that of the dominant (D°,X) peak. This material is therefore ideal for implantation studies of acceptors, since even very weak peaks due to low dose implants will be readily visible above the residual background peaks. Pieces of the above wafer were implanted with 24Mg, 9Be, or 12C ions, using four different energies in each case to achieve a roughly flat profile from about 20 to 430 nm. The average concentration was set to be 1015, 1016, and 1017 cm−3 in different pieces for each impurity. The samples were then encapsulated with a ∼50−70 nm thick layer of AlON, which was reactively sputtered using a high purity Al target, Ar, and N2. The samples were heated to 500 °C during the sputtering process. Rapid post-implantation thermal annealing was then performed for 8 s at 1300 °C in flowing N2.
Photoluminescence (PL) spectra were then recorded using excitation provided by a He-Cd laser at 325 nm or by an Ar+ laser at 305.5 nm. Details of the measurement system are given elsewhere [Reference Skromme, Zhao, Goldenberg, Kong, Leonard, Bulman, Abernathy and Pearton8]. All spectra are corrected for the spectral response of the measurement system.
Photoluminescence of Mg, Be, and C Implanted GaN
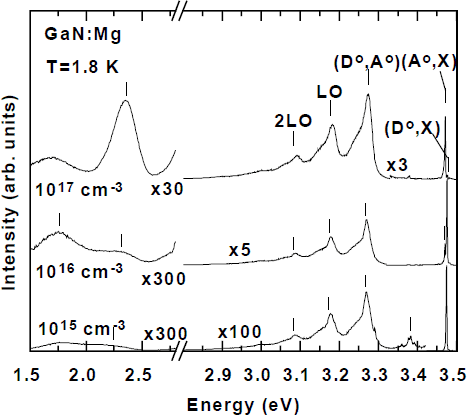
Low temperature PL spectra as a function of implantation dose are shown in Figure 1 for the case of Mg implantation. The highest energy peaks involve donor and acceptor-bound excitons and are discussed below. Even at the lowest dose (1015 cm−3), a clear (D°-A°) peak at 3.270 eV and its LO and acoustic phonon replicas become visible, although they are more than 100× weaker than the original (D°,X) peak. In contrast, unimplanted control samples annealed under the same conditions show essentially no changes in their spectra (not shown), except for an overall increase in the absolute intensity of the spectrum and a slight broadening of the (D°,X) peak to 3.6 meV FWHM. The new peaks can therefore be assigned unambiguously to the implanted Mg atoms (they did not occur at similar doses for Be and C, as discussed below). Moreover, a clear dose dependence is observed; the (D°-A°) peak grows steadily stronger compared to the excitonic peaks with increasing dose (note the various vertical scale expansion factors). It also becomes broader due to the increasing impurity content. In the deeper portions of the spectrum (note the broken axis), a new green PL band becomes prominent at 2.35 eV, together with a weaker red band around 1.73 eV (again note the much reduced vertical scale expansion factor at the highest dose). It is not clear from our data if either deep band is uniquely associated with Mg impurities, since they might simply originate from defects whose formation is stimulated by moving the Fermi level close to the valence band.

Figure 1. Overall PL spectra of Mg-implanted HVPE GaN as a function of dose.
Study of the Mg-related features is facilitated by the narrow linewidths in these spectra and by the absence of features which may arise from the presence of H [Reference Johnson, Yu, Boney, Hughes, Cook, Schetzina, Zhao, Skromme and Edmond9]. The (D°-A°) peak shifts to higher energy with increasing excitation intensity at a rate of a few meV per decade of intensity and broadens (not shown). This is the normally expected saturation behavior expected for this type of transition, due the Coulomb interaction in the final state. The temperature dependence of the spectra is shown in Figure 2 for the lowest implantation dose, since that sample shows the best-resolved peaks as a function of temperature. As the temperature increases, the (D°,X) peak quenches in favor of A free exciton (XA) recombination, and shifts to lower energy as the band gap is reduced. The (D°-A°) peak quenches in favor of a distinct, higher energy peak located, e.g. at 3.284 eV at 50 K. This peak grows to dominate the spectrum at the highest temperature and becomes broader. We therefore attribute it to conduction band-to-acceptor (e-A°) transitions involving the Mg acceptor level, which become dominant as the shallow donors thermally ionize into the conduction band. The XA position at 50 K is 3.479 eV. Adding the previously determined value of the free exciton binding energy to this value (26.4 meV [Reference Skromme, Zhao, Goldenberg, Kong, Leonard, Bulman, Abernathy and Pearton8]) yields a band gap at this temperature (including any effects of strain) of 3.505 eV. The (e-A°) peak position then yields a Mg acceptor binding energy of 224 meV (accounting for the kT/2 kinetic energy of the free electrons), in good agreement with our prior determination [Reference Johnson, Yu, Boney, Hughes, Cook, Schetzina, Zhao, Skromme and Edmond9].

Figure 2. Temperature dependence of the PL spectra of a lightly Mg-implanted sample.
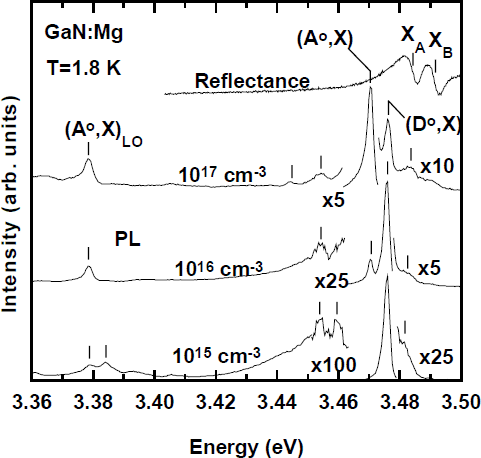
The excitonic portions of the PL spectra in Figure 1 are shown in more detail in Figure 3, to illustrate their dependence on Mg dose. A simple reflectance spectrum of the 1016 cm−3 sample is also included, to aid in identifying the A and B free exciton features. Similar reflectance spectra were recorded on each sample, and some PL spectra in Figure 3 have been rigidly shifted by up to 2 meV to align the XA peaks, to compensate for minor strain variations and facilitate comparisons. In the lowest dose sample, the (D°,X) peak at 3.4760 eV remains dominant as it was in the starting material. A very weak neutral acceptor-bound exciton (A°,X) peak is however also observed at 3.4704 eV, which was absent in the starting material. This peak is even more clearly evidenced in the LO phonon replicas of the bound excitons, where its phonon replica is comparable in strength to that of the (D°,X) peak at 3.384 eV. This effect is due to the characteristically much stronger LO phonon coupling strength of the (A°,X) peak compared to the (D°,X) peak [Reference Johnson, Yu, Boney, Hughes, Cook, Schetzina, Zhao, Skromme and Edmond9]. As the dose is increased, the (A°,X) peak increases in intensity relative to the (D°,X) peak and eventually dominates it. The (A°,X) peak is quite sharp (2.6 meV FWHM), enabling an accurate determination of the localization energy of the Mg acceptor-bound exciton as about 12.2 meV. This value is in reasonable agreement with the ∼11 meV value derived from homoepitaxial Mg-doped material [Reference Godlewski, Wysmolek, Pakula, Baranowski, Grzegory, Jun, Porowski, Bergman and Monemar10], although it is smaller than the ∼14-16 meV value we derived earlier from MBE GaN:Mg with much broader excitonic linewidths [Reference Johnson, Yu, Boney, Hughes, Cook, Schetzina, Zhao, Skromme and Edmond9]. The present value should be more accurate.

Figure 3. Excitonic portion of the PL spectra of Fig. 1 on an expanded scale, together a simple reflectance spectrum of the 1016 cm−3 dose sample.
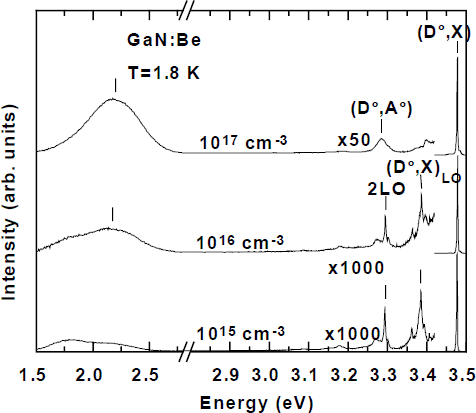
The behavior of the Be and C implanted samples is dramatically different. The overall PL spectra are shown as a function of implantation dose for the C case in Figure 4. No (A°,X) peak whatsoever or its LO phonon replica can be detected at any of the three doses. Moreover, only a weak (D°-A°) peak (note the scale expansion factors), possibly involving C acceptors, can be detected at the highest dose. The activation efficiency is estimated to be least 50× worse than that of Mg. Judging from the (D°-A°) peak position, the C acceptor level may be about 15 meV shallower than that of Mg, but data on more clearly activated samples will be necessary to obtain a reliable value. In the deep portions of the spectrum, the 2.2 eV yellow PL band is strongly enhanced with increasing dose. This effect might be taken as evidence that the yellow band directly involves C impurities, as argued previously [Reference Zhang and Kuech11]. However, we observe an identical effect in Be implanted material, as shown in Figure 5. It therefore appears much more likely that the yellow PL band is somehow enhanced by residual implantation damage, as observed by Pankove and Hutchby [Reference Pankove and Hutchby1]. This band is notably absent, however, in the Mg-implanted material, which might be due to the change in Fermi level resulting from the effective p-type doping with Mg. The Fermi level position may influence the formation of this defect [Reference Saarinen, Nissilä, Hautojärvi, Likonen, Suski, Grzegory, Lucznik and Porowski12].

Figure 4. Overall PL spectra of C-implanted HVPE GaN as a function of dose.

Figure 5. Overall PL spectra of Be-implanted HVPE GaN as a function of dose.
The data as a function of Be implantation dose in Figure 5 are in all respects quite similar to that of the C-implanted case in Figure 4. Again a slightly shallower, and less strongly phonon-coupled (D°-A°) peak is introduced, but only weakly and at the highest dose. We see no evidence for a much shallower, ∼3.385 eV (D°-A°) peak reported previously in MBE GaN:Be [Reference Dewsnip, Andrianov, Harrison, Orton, Lacklison, Ren, Hooper, Cheng and Foxon13,Reference Sánchez, Calle, Sanchez-Garcia, Calleja, Muñoz, Molloy, Somerford, Koschnick, Michael and Spaeth14]. Our (D°-A°) peak is more similar to the deeper one observed in MBE GaN:Be by Salvador et al. [Reference Salvador, Kim, Aktas, Botchkarev, Fan and Morkoç15].
Several possible explanations could be advanced to explain the poor optical activation of Be and C in our samples, compared to that of Mg. It could be assumed that these elements simply do not produce shallow acceptor levels in GaN, or that they are naturally reluctant to incorporate substitutionally to do so. In particular, Be might be expected to form interstitial donors (although we see no direct spectro-scopic evidence of new donor states). We believe, however, that the problem could be linked to the lighter mass of these elements compared to that of Mg. They produce less damage when implanted, and fewer vacancies are therefore created for them to substitute into. Further experiments are planned to co-implant inert elements of mass similar to Mg (such as Al) together with Be and/or C. If shallow acceptor levels do not appear under those conditions, the problem must be linked to the fundamental behavior of these species in GaN.
Properties of Zn Acceptor Levels in Zn-Doped HVPE Material
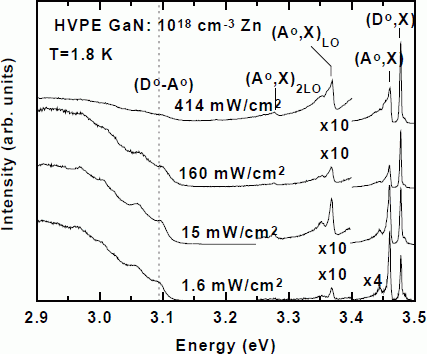
We also investigated the PL properties of a Zn-doped HVPE layer to determine the properties of Zn acceptors in GaN. The structure consisted of a 17 µm thick undoped GaN buffer layer on a sapphire(0001) substrate, followed by a 1.5 µm thick layer doped with Zn to a concentration of roughly 1×1018 cm−3. The sample was grown in the same reactor used to produce our undoped wafer, so the observed new features can be confidently attributed to Zn. The resulting PL spectra are shown in Fig. 6 as a function of excitation intensity. In addition to the usual residual (D°,X) peak at 3.4774 eV, we observe a prominent new acceptor-bound exciton at 3.4595 eV, with a localization energy with respect to the A free exciton of 24.5 meV. This value is in good agreement with previous data published by Amano et al. [Reference Amano, Hiramatsu and Akasaki16]. The (A°,X) peak is accompanied by prominent LO phonon replicas as well as a lower energy satellite feature at 3.444 eV of undetermined origin. A broad, structured emission extending from ∼2.6 to 3.1 eV (peaking at ∼2.92 eV) is also observed as seen previously [Reference Ilegems, Dingle and Logan17]. We clearly resolve the no-phonon feature of this structure at around 3.1 eV, together with a series of LO and probably acoustic phonon replicas with strong coupling strengths. Most significantly, we observe a clear shift of the no-phonon peak to higher energy with increasing excitation intensity, positively identifying it as a (D°-A°) transition. Comparing the (D°-A°) peak position to that of Mg, we estimate the binding energy of the Zn acceptor as 400 meV.

Figure 6. PL spectra as a function of excitation intensity for HVPE GaN doped with 1018 cm−3 Zn during growth.
Conclusions
We have demonstrated that low dose ion implantation into high purity material, coupled with suitably high temperature annealing in a H-free ambient, is a highly suitable method to study the spectroscopic properties of impurities in GaN. Successful study of low mass impurities may however require either co-implantation with heavier elements or annealing at even higher temperatures. Both types of experiment are planned.
Acknowledgements
This work was supported by the Materials Research Science and Engineering Center at ASU, under Grant No. DMR 96-32635 from the National Science Foundation. We very gratefully acknowledge R. Molnar of MIT Lincoln Laboratories for providing the undoped and Zn-doped HVPE material used in this work.


