


Introduction
Treatments of moving targets in the thorax and abdomen affected by respiration introduce uncertainty and may degrade treatment aims. Respiratory motion during intensity-modulated radiotherapy (IMRT) delivery blurs the dose distribution and can introduce the interplay between the movements of both organs and the treatment apparatus. The interplay effect is of concern in volumetric modulated arc therapy (VMAT) treatments, during which high dose conformity is achieved by the simultaneous variation in the multileaf collimators (MLCs), gantry rotational speed and dose rate Reference Otto1 , which may affect the spatial dose distribution Reference Bortfeld, Jiang and Rietzel2 . Furthermore, the issues that arise from intrafraction motion are of concern when high doses in few fractions are delivered —stereotactic ablative radiotherapy (SABR) is an example. The utilisation of a high dose rate from flattening filter-free (FFF) beams with SABR deliveries offers shorter irradiation time with high beam modulation Reference Xiao, Kry and Popple3 . The demand for high precision and improved target localisation to deliver the escalated target dose per fraction necessitates quantifying the interplay effect for SABR deliveries.
The interplay effect is a complex phenomenon affected by several factors, including breathing motion characteristics and radiation delivery features. Breathing is an individualised biological process that can vary significantly between patients and cause unpredictable influences. The effect of breathing period Reference Gauer, Sothmann, Blanck, Petersen and Werner4–Reference Riley, Yang, Li, Zhang, Heron and Huq8 , amplitude Reference Leste, Medjahed and Arnaud7–Reference Sarudis, Karlsson, Nyman and Bäck12 , breathing pattern Reference Edvardsson, Nordström, Ceberg and Ceberg5,Reference Pan, Shiau, Li, Hsu and Liang13–Reference Court, Wagar and Berbeco16 , number of breaths (NBs) during irradiation Reference Leste, Medjahed and Arnaud7,Reference Kubo, Monzen and Tamura17–Reference Thaper, Oinam and Kamal19 and the initial breathing phase Reference Edvardsson, Nordström, Ceberg and Ceberg5,Reference Sasaki, Nakamura and Mukumoto20,Reference Adamczyk, Kruszyna-Mochalska, Rucińska and Piotrowski21 have been extensively studied for lung and liver cancer.
A range of breathing periods, patterns and peak-to-peak extents have been examined, and higher interplay was associated with longer breathing periods, large motion amplitudes and irregular breathing patterns Reference Gauer, Sothmann, Blanck, Petersen and Werner4–Reference Riley, Yang, Li, Zhang, Heron and Huq8,Reference Sarudis, Karlsson, Nyman and Bäck12,Reference Pan, Shiau, Li, Hsu and Liang13,Reference Kubo, Monzen and Tamura17 . Olding and Alexander (Reference Olding and Alexander2017) studied breathing rates of 7, 15 and 23 breaths per minute (BPM), and 1% dose difference was observed with low breathing rates for a point dose measurement, which was not clinically significant Reference Olding and Alexander6 . In another study, the effect of longer breathing periods and abnormal breathing regularity showed a clinical target volume (CTV) underdosage of 78% in the V98%, reported from the dose area histogram assessment Reference Gauer, Sothmann, Blanck, Petersen and Werner4 . Breathing features were also examined with gated and non-gated SBRT plans, and gated deliveries showed good target coverage (average = 92·2%), despite some breathing irregularities Reference Pan, Shiau, Li, Hsu and Liang13 . Amplitudes of 15 mm and more were associated with higher dose differences for D2%, Dmean and Maxdiff as reported by Sarudis et al. (2022) Reference Sarudis, Karlsson, Nyman and Bäck12 .
An increased NBs per delivery was associated with a lower interplay effect. A decreased dose deviation of 3% was reported when the NBs increased to more than 40 (≥16 breath/min) Reference Kubo, Monzen and Tamura17 . Also, NBs less than 20 had a noticeable interplay effect for a 6 FFF VMAT-SBRT delivery when the simulated breathing had a 7-sec period Reference Leste, Medjahed and Arnaud7 . The long irradiation time of non-FFF VMAT-SBRT, because of the higher monitor units (MUs) and MU/segment, increased the number of segments, and slower gantry speed required to deliver the escalated SBRT dose allowed increased NBs to pass during the irradiation. This reduced dose errors despite the higher MLC modulation Reference Edvardsson, Nordström, Ceberg and Ceberg5,Reference Tyler11,Reference Hubley and Pierce22 .
The second factor that influences the interplay effect is the radiation delivery features, which include plan complexity Reference Gauer, Sothmann, Blanck, Petersen and Werner4,Reference Thaper, Oinam and Kamal19,Reference Sasaki, Nakamura and Mukumoto20,Reference Hubley and Pierce22–Reference Ge, Wang, Chen, Sun, Li and Shi25 , target size Reference Edvardsson, Nordström, Ceberg and Ceberg5 , dose levels Reference Edvardsson, Nordström, Ceberg and Ceberg5,Reference Leste, Medjahed and Arnaud7,Reference Sande, Acosta Roa and Hellebust24 , dose rate Reference Leste, Medjahed and Arnaud7,Reference Thaper, Oinam and Kamal19 , the number of arcs and number of fractions Reference Shintani, Nakamura and Matsuo18–Reference Sasaki, Nakamura and Mukumoto20,Reference Netherton, Li and Nitsch23,Reference Sande, Acosta Roa and Hellebust24 . Several metrics have been defined to assess IMRT plan complexity. The number of MUs and the modulation factor (MF) have been commonly used as the easiest metrics. The plan intensity map variation Reference Coselmon, Moran, Radawski and Fraass26 , modulation index Reference Webb27 and the modulation complexity score (MCS) Reference McNiven, Sharpe and Purdie28 were used for plan complexity assessment. Clinical target volume underdoses were reported for highly modulated plans compared with moderate modulation plans Reference Gauer, Sothmann, Blanck, Petersen and Werner4 . Also, there was a higher susceptibility of the interplay effect for hepatic plans with a high MF (p < 0.05). A maximum dose difference of 1 Gy was reported which is equivalent to 2% of the prescribed dose Reference Hubley and Pierce22 .
As different treatment planning systems can generate various MLC sequences, it was recommended to limit the use of highly modulated plans to reduce interplay consequences Reference McGarry, Chinneck, O’Toole, O’Sullivan, Prise and Hounsell29 .
Studies used flattened and unflattened beams to refer to high- and low-dose-rate plans and found that, as the dose rate increased, the interplay effect also increased Reference Edvardsson, Nordström, Ceberg and Ceberg5,Reference Court, Wagar and Berbeco16 . The reason for the effect’s increase was that FFF plans tend to have complex MLC sequences compared with non-FFF plans Reference Edvardsson, Nordström, Ceberg and Ceberg5 . Also, a shorter time is required to deliver the dose with FFF beams, which means a lower NBs occurred during the treatment.
The interplay effect was less significant whenever the averaging effect was applied, such as when there were a higher NBs during treatment. Low dose rates were recommended for treating moving targets when no motion management techniques were considered Reference Jiang, Pope, Al Jarrah, Kung, Bortfeld and Chen30 . Studies suggested the use of a double arc instead of a single arc when applying VMAT-SBRT Reference Shintani, Nakamura and Matsuo18 , to reduce the interplay effect by allowing the averaging of the effect Reference Court, Wagar and Berbeco16 . Ge et al. (2022) reported a maximum dose difference of 34·5% between five dynamic lung measurements started at random respiratory phases for a single arc plan of a high complexity Reference Ge, Wang, Chen, Sun, Li and Shi25 . Plans of high MLC modulation showed a 5% maximum dose error for a single arc, which declined to 3% in the plan sum of the two arcs Reference Ong, Verbakel, Cuijpers, Slotman and Senan31 .
The estimation of the interplay effect presented in this study applies the same simulation-based approach presented in a previous piece of work Reference Varasteh, Ali and Esteve32 . The benefit of this validated simulation method is a better pre-treatment understanding of the interplay characteristics for different motion amplitudes and NBs by acquiring a single static dose measurement. It also enables the investigation of the influence of the size of the GTV and the plan complexity in determining the dosimetric errors without the need for actual phantom delivery. In this study, the simulation covered a wider range-of-motion amplitudes (0 – 25 mm) and NBs (5 - 50), to quantify a worst-case scenario of the interplay effect. It also considered the plan-specific characteristics to quantify dosimetric errors associated with FFF VMAT-SABR deliveries.
Materials and Method
Treatment planning and delivery systems
Thirteen lung SABR patients underwent free-breathing 4DCT as a part of their treatment and underwent RapidArc treatment on a Varian TrueBeam (Varian Medical Systems, Palo Alto, USA) machine equipped with a Millennium 120-leaf MLC. The selected beam energy and dose rate were 6 MV FFF beams and 1400 MU/min, respectively. The dose delivery followed the fractionation schemes of 8 × 7·5 Gy, 3 × 18 Gy and 5 × 11 Gy. No plans had an avoidance sector, except plan No.1 (80·2° - 39·5°). Illustrations of the plan’s parameters are shown in Table 1.
Table 1. Characteristics of patients’ treatment plans

Abbreviations: PTV, planning target volume in cubic centimetres; MCS, modulation complexity score.
All 13 patients’ plans were calculated in the Eclipse treatment planning system v.16·0 (Varian Medical Systems, Palo Alto, USA) and delivered to the treatment plan verification system OCTAVIUS 4D (OCT4D) (PTW-Freiburg, Germany). The 1000SRS 2D detector array used as a part of the system consists of 977 liquid-filled ionisation chambers with an outer area of 11 × 11 cm2. The space between the detectors at the central area of 5·5 × 5·5 cm2 is 2·5 mm, and the outer area of 11 ×11 cm2 has a spacing of 5 mm. The detector resolution is 0·1 mGy/min for the range of dose rates 0·1 to 36 Gy/min 33 .
With the aid of in-house software, the static measurements were convolved with a sinusoidal breathing pattern with different range-of-motion amplitudes Reference Varasteh, Ali and Esteve32 . Finally, the plan verification software Verisoft V6·2 (PTW-Freiburg, Germany) was used for dose comparison.
Dose measurements and evaluation
This work considered the same methodology of dose measurements detailed in a previous piece of work Reference Varasteh, Ali and Esteve32 . The static dose distribution and measured dose distribution (MDD) in a virtually moving phantom with the beam starting at end-inhalation of 0% and end-exhalation of 50% were obtained through the following steps:
-
1. All plans were re-calculated and delivered using the OCT4D phantom on the couch without motion to acquire the static dose distribution.
-
2. Via in-house software, the phantom position (off-axis information) and the superior-inferior (SI) breathing motion were utilised to generate the time-dependent translation files with the Extensible Markup Language (XML) format. A total of 2100 plans of the two starting phases, 0% and 50%, were generated.
-
3. An alpha version of the plan verification software Verisoft was used to apply the translation files to the static measurements to reconstruct the 3D dose distribution simulating the condition of the moving phantom.
Interplay Effect Evaluation
Breathing characteristics
The influence of the NBs during the SABR irradiation and the effect of breathing motion amplitude were examined using a sinusoidal motion with 0 mm, 5 mm, 10 mm, 15 mm, 20 mm and 25 mm motion amplitudes. The motion amplitudes were selected to cover the range of lung tumour motion determined in a previous study conducted at our institution Reference Ali, Greenwood and Walls34 . The simulated 0 mm motion amplitude illustrates the absence of target motion (static target), and the 25 mm amplitude corresponds to a relatively large tumour excursion.
The breathing period (T) for each of the user-defined NBs was calculated using the following equation:
 $$T\;\left( {{\rm{sec}}} \right) = \;{{Irradiation\;Time\;\left( {{\rm{sec}}} \right)} \over {Number\;of\;breaths\;\left( {NBs} \right)}}$$
where ‘Irradiation Time’ is the treatment time required to deliver the two partial arcs (including the time required to change the collimator angle), ‘NBs’ is the number of breaths for each plan ranging from 5–50 with a five-breath increment.
The dose distribution of two extreme initial breathing phases (MDD 0% and MDD 50%) was considered to evaluate the potential for interplay effects. This phase selection allows the simulation of the worst-case scenario. The 2% dose difference/2 mm distance to agreement gamma evaluation criteria with dose suppression 10% and 50% thresholds were applied Reference Xia, Adamson, Zlateva and Giles35 . A 90% tolerance level on the gamma-passing rate was considered as suggested by Heilemann et al (2013) Reference Heilemann, Poppe and Laub36 for the 2%/2 mm criteria, as this criterion is sensitive to VMAT errors.
Plan characteristics
The 13 plans have different PTV sizes ranging from 7·1 to 80·4 cubic centimetres. The effect of the PTV size on the interplay effect was examined. The MCS was used as a plan complexity metric. It included the variability and irregularity in leaf positions and field shapes along with segment weight to assess an IMRT field for plan complexity. All VMAT DICOM-RT plans were analysed via in-house software to determine the degree of complexity following the Modulation Complexity Score (MCS) Reference McNiven, Sharpe and Purdie28,Reference Masi, Doro, Favuzza, Cipressi and Livi37 . The MCS ranges from 0–1, where 0 refers to high complexity and 1 refers to an open field with no complexity.
The interplay effect for patients with high motion amplitudes
A group of n = 49 lung SABR patients with high motion amplitudes (Min: 1·00 cm, max: 2·67 cm) out of a dataset of 260 patients was considered Reference Ali, Greenwood and Walls34 to nominate the patients with low NBs (≤20). Using the mean breathing period measured from the real-time position management (RPM) breathing file and total irradiation time from the oncology information system ARIA (Varian Medical Systems, Palo Alto, USA), the NBs during irradiation were measured for all patients. The patient with the lowest NB was considered for further analysis using our simulation tool with the patient’s RPM breathing file.
Statistical Analysis
Statistical analysis was performed using SPSS version 27 (SPSS Inc., Chicago, IL). The Pearson correlation was used to assess the correlation between the NBs, motion amplitude, PTV size and MCS. Further, a multiple regression model was utilised for the gamma-passing rate as a dependent variable (10% and 50%), and the motion amplitude, NBs, PTV size and MCS as predictor variables.
Results
Breathing characteristics
Figures 1 and 2 demonstrate the results of the comparison of the dose distribution in the plans of 13 patients between the end-inhalation 0% and end-exhalation 50% breathing phases simulated with a range-of-motion amplitudes that cover the range of lung tumour motion and range of NBs from low (5) to high (50). A general trend of reduction in the gamma-passing rate was observed as the motion amplitude exceeded 5 mm for both thresholds in Figures 1A and 1B. The dominant effect of the NBs as the motion amplitudes increase is shown in Figures 2A and 2B. The gamma-passing rate increases rapidly as the NBs increase for the range-of-motion amplitudes. The 5 NBs had the lowest gamma-passing rate, and the worst interplay effect was found for the 5 NBs with 25 mm motion amplitude (30·9 %). Figure 3 shows an example of the gamma pass rate of a patient plan (plan 12) illustrating the relationship between the gamma pass rate and the NBs for a range-of-motion amplitudes. Figure S.1 in the supplementary document shows the effect of the NBs on the gamma-passing rate for all other plans.
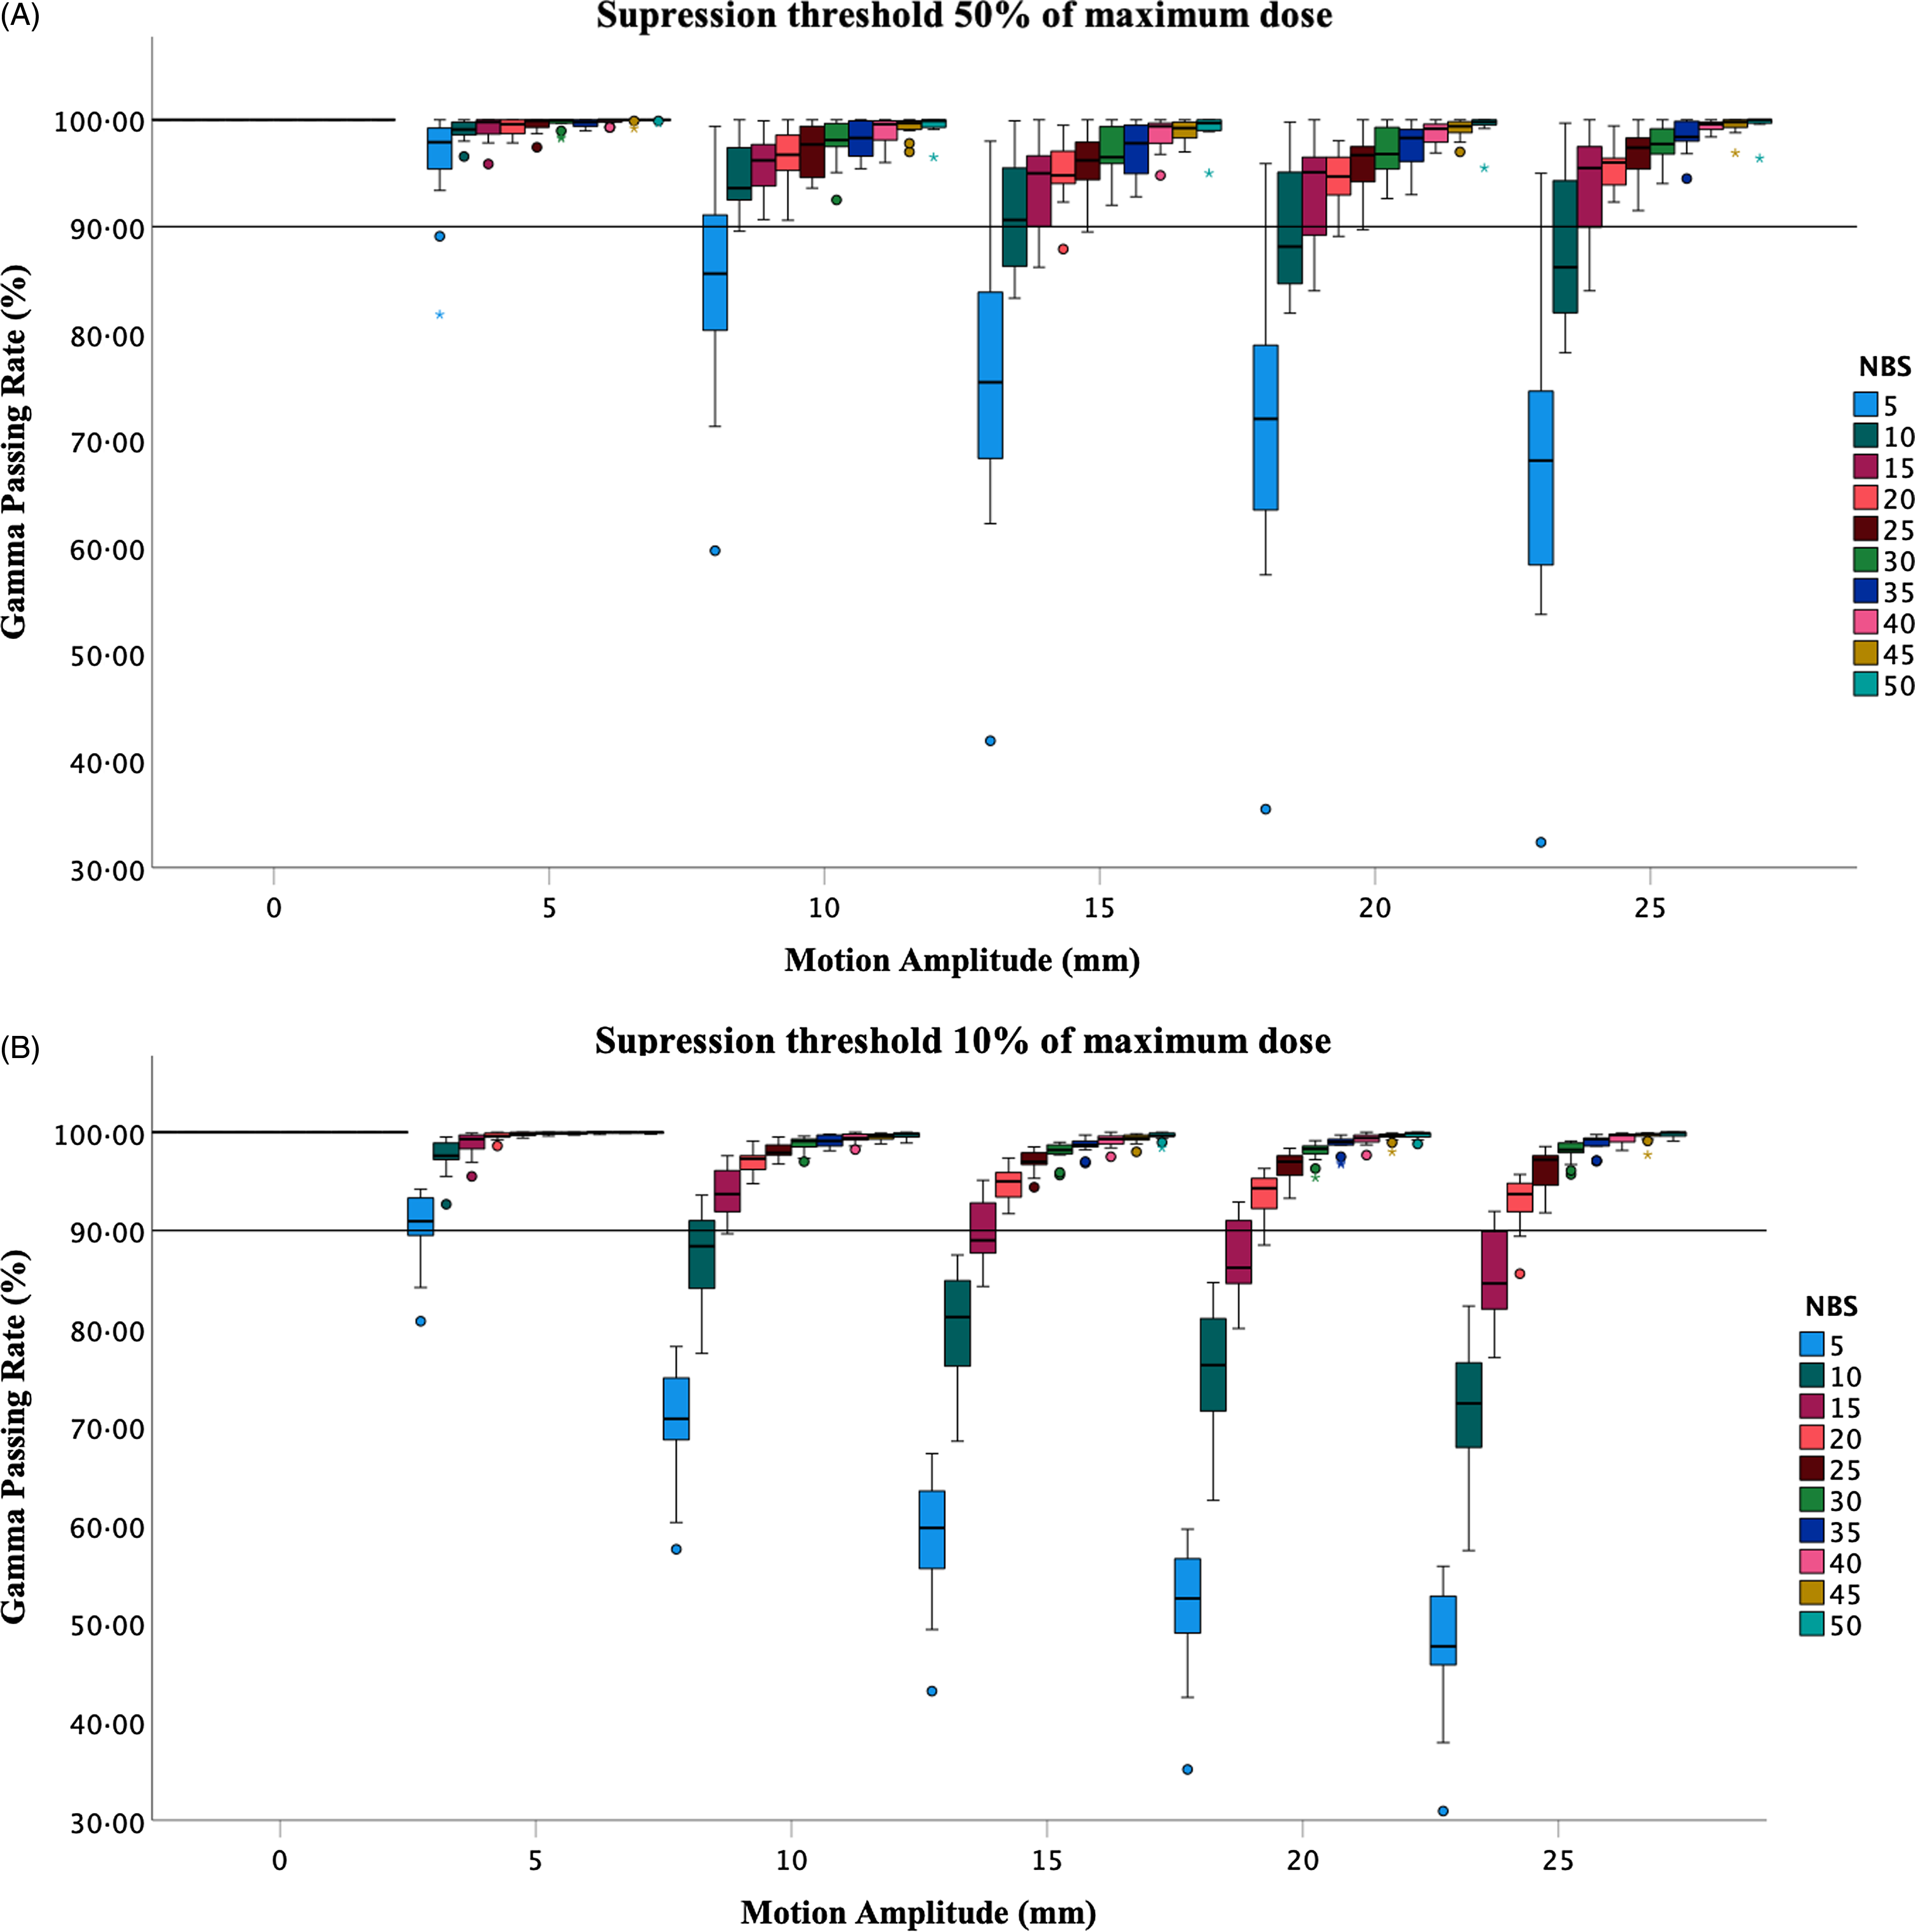
Figure 1. A box plot of the gamma-passing rate (phase 0% versus phase 50%) of all 13 plans as a function of the motion amplitude, for different number of breaths, with 10% (A) and 50% (B) dose thresholds. The solid line represents the 90% tolerance level.

Figure 2. A box plot of the gamma-passing rate (phase 0% versus phase 50%) of all 13 plans as a function of the number of breaths with 10% (A) and 50% (B) dose thresholds. The solid line represents the 90% tolerance level.

Figure 3. The gamma-passing rate of plan 12 at different motion amplitudes (0 to 25 mm) with 10% (A) and (50%) dose suppression thresholds illustrating the reduction in the passing rate with increasing the motion amplitude.
The percentage of plans with a gamma-passing rate exceeding the 90% tolerance level for 10% and 50% suppression thresholds for all motion amplitudes is shown in Table 2. None of the 13 plans had a gamma-passing rate above 90% for high motion amplitudes (>5 mm) and 5 NBs. All plans had more than 90% gamma-passing rate for all amplitudes when the number of breaths was >20 for the 10% and 50% thresholds, except for 15 mm (NBs >25 for the 50% threshold). Increased motion extents >5 mm had a gamma pass rate <90% for low NBs 5–20.
Table 2. Percentage of plans that have a gamma-passing rate above a tolerance level of 90% for the range of NBs and motion amplitudes with 10% and 50% dose thresholds. The 0% indicates that none of the 13 plans have a gamma rate above 90%, and 100% means all 13 plans have a gamma rate above 90%

Abbreviations: MCS, modulation complexity score; NBs, number of breaths.
Plan characteristics
The parameters related to the VMAT plan, including the PTV size and MCS, indicated very weak correlation between the gamma-passing rate (10% and 50% thresholds) and these parameters as presented in Table 3. There was absence of correlation between the PTV size and the gamma pass rate of both thresholds. The modulation complexity score showed a very weak correlation with the gamma pass rate of 10% threshold, and a weak correlation with the 50% threshold just at low motion amplitudes (5–15 mm).
Table 3. Pearson correlation coefficient of the MCS, PTV in cubic centimetres and the NBs for the considered motion amplitudes

Abbreviations: MCS, modulation complexity score; NBs, number of breaths; PTV, planning target volume.
The multiple regression model of the amplitude, PTV, MCS and NBs for the 10% threshold illustrated a statistically significant contribution from the NBs and the motion amplitude (p < 0·001) and a non-statistically significant contribution from the MCS and the PTV size, p = 0·10, and p = 0·25, respectively, in the interplay effect. In this model, 52% of the dependent variable is explained by the predictor variables. The multiple regression model for the 50% dose threshold illustrated a statistically significant contribution from the NBs, MCS, PTV size and the motion amplitude (p < 0·001) in the interplay effect. In this model, 38% of the dependent variable is explained by the predictor variables. Figures showing the PTV and MCS of all plans with different amplitudes and NBs are listed in the Supplementary document.
Figures 4 and 5 show the gamma failing points and the corresponding profiles of the VMAT plan with the lowest complexity (plan 12) and the highest complexity (plan 1) in the transverse plane. The failing points of the VMAT plan with the highest complexity are located inside the target volume, whereas the failing points of the plan with the lowest complexity are outside the target. Both plans have failing points outside the high-dose region.

Figure 4. The gamma-passing rate of 25 number of breaths and 25 mm motion amplitude (phase 0% (orange profile) versus phase 50% (blue profile)) of the lowest complexity plan (0·199 modulation complexity score) in the transverse plane (A) and a sagittal view of the gamma pass-fail map (B) using the 2%/2 mm gamma criteria along with the LR corresponding profiles (yellow line in A and B). The points that failed the gamma criteria are presented in red (overdosage) and blue (underdosage).

Figure 5. The gamma-passing rate of 25 number of breaths and 25 mm motion amplitude (phase 0% (orange profile) versus phase 50% (blue profile)) of the highest complexity plan (0·03 modulation complexity score) in the transverse plane (upper panel) and a sagittal view of the gamma pass-fail map (B) using the 2%/2 mm gamma criteria along with the LR corresponding profiles (yellow line in A and B). The points that failed the gamma criteria are presented in red (overdosage) and blue (underdosage).
The interplay effect for patients with high motion amplitudes
Eight patients had low NBs during irradiation (≤20), which corresponds to 3% of the considered dataset, see Table 1 in the supplementary material. Using the in-house software, the interplay assessment for the patient with lowest number of breaths (NBs ∼12) showed a high interplay effect with a gamma pass rate of 87·8% and 84·1% (2%/2 mm with 10% and 50% suppression thresholds, respectively). Figure 6 shows a transverse view (A) and a sagittal view (B) of the gamma pass-fail map, and their corresponding Left-Right (LR) profiles (C and D) for the criteria 2%/2 mm.

Figure 6. The gamma pass rate in the form of a pass-fail map (failing points) in the transverse plane (A), and the hot (overdose) and cold (underdose) areas in the sagittal plane (B) inside and outside the planning target volume. The corresponding LR profiles of each view are shown in C and D (yellow LR line). The gamma fail map shows the difference between the two dose distributions considering the gamma criteria with 0 indicates (Pass points), and gamma ≥1 indicates failing points.
Discussion
The estimation of the interplay effect presented here builds on our simulation-based approach reported in the previous work. The results show a reduction in the gamma-passing rate as the motion amplitude increases (>5 mm). In addition, a high interplay effect was observed for long breathing periods (reduced NBs). No correlation was found between the gamma-passing rate and the PTV size and MCS for all amplitudes. The multiple regression model of the amplitude, PTV size, MCS and NBs for both dose thresholds (10% and 50%) illustrated a statistically significant contribution from the NBs and the motion amplitude (p < 0·001). It also confirms the absence of relationship between the MCS and PTV to the interplay effect (for a 10% dose threshold). The patient assessment indicated a high interplay effect for low NB (≤20) and high-motion amplitude.
The dose deviations introduced by the interplay effect when treating lung SABR have been studied for patient-based factors and delivery-related factors. Based on the findings in Table 2, an increased extent of motion has been associated with high dosimetric errors (gamma-passing rate less than 90% tolerance level), especially with reduced NBs (≤20 NBs, >10 mm). This represented 3% of a previously investigated cohort Reference Ali, Greenwood and Walls34 . High motion amplitudes can cause large anatomical changes, and can, subsequently, increase uncertainty. The effect of the number of BPM and the motion amplitude was studied for 10 VMAT-SABR plans of different amplitudes (8–15 mm) and BPM Reference Thaper, Oinam and Kamal19 . They reported increased dose variations with reduced BPM and high motion amplitudes (BPM: R2 = 0·74, p < 0·001). Sarudis et al. Reference Sarudis, Karlsson, Nyman and Bäck12 reported a lack of correlation between the tumour motion amplitude and dose errors; however, tumour motion exceeding 15 mm had the largest deviations. The maximum GTV dose difference for high motion amplitudes was up to 35·2% in VMAT plans compared with 8·9% in conformal arc plans.
The increase in the NBs during irradiation has been associated with lower dose discrepancies Reference Kubo, Monzen and Tamura17 . The work presented in this manuscript agrees with that reported, with NBs >20 showing a gamma-passing rate exceeding the 90% tolerance level (10% dose threshold) and NBs > 25 (50% dose threshold) Reference Varasteh, Ali and Esteve32 . The simulations started with 5 NBs to simulate unrealistic breathing scenarios and were increased in steps of 5 up to 50 NBs to simulate an extremely short breathing period, which might occur due to a local irregularity during patient breathing. Number of breaths is a breathing-specific factor and is influenced by the treatment technique and other specifications that may lengthen or shorten the treatment time. The length of the irradiation time will determine the NBs that pass during delivery. Studies have shown the superiority of the use of double arcs over single arcs Reference Court, Wagar and Berbeco16,Reference Shintani, Nakamura and Matsuo18 , as double-arc deliveries tend to be longer allowing high NBs to pass. Also, the use of low dose rates has a similar effect Reference Jiang, Pope, Al Jarrah, Kung, Bortfeld and Chen30 .
The hypofractionation scheme of SABR deliveries might be a source of concern, as the averaging effect of dose discrepancies may not be applicable, especially with single-fraction SABR treatments. However, the reported interplay errors for VMAT SBRT were within the clinically acceptable range Reference Tyler11,Reference Shintani, Nakamura and Matsuo18,Reference Hubley and Pierce22,Reference Sande, Acosta Roa and Hellebust24,Reference Rao, Wu and Cao38 despite the lower number of fractions. Other parameters (low dose rate, double arcs and higher doses) compensated for this hypo-fractionated dose delivery method.
In this manuscript, complex VMAT SBRT plans with 6 FFF beams were considered. The results suggest the lack of correlation between plan complexity and the interplay effect. Nevertheless, the treatment plan with the highest complexity (MCS: 0·03) showed the highest interplay effect for all amplitudes and NBs. Similarly, Ge et al. (2022) reported high gamma-passing rates for low-complexity plans compared with complex plans Reference Ge, Wang, Chen, Sun, Li and Shi25 . Increased plan complexity and high motion amplitudes resulted in a high standard deviation SD% and maximum dose difference Reference Ge, Wang, Chen, Sun, Li and Shi25 . This was the case with plan no.1 (highest complexity) and an amplitude of 25 mm when the NBs were low. The size of the PTV showed no correlation with the interplay effect (threshold 10%). This is in contrast to Edvardson et al. Reference Edvardsson, Nordström, Ceberg and Ceberg5 who reported that the initial breathing phase had a noticeable effect with smaller CTV sizes (1–3 cm), as the studied CTV volume was comparable to the magnitude of the hot and cold spots. They observed hot and cold spots in the CTV when the phases 0%, 25%, 50% and 75% were considered for beam starting (simulating different fractions). However, no dose difference was observed when the average dose distribution of the four phases was measured Reference Edvardsson, Nordström, Ceberg and Ceberg5 . Figures 4 and 5 show a comparison between the PTVs of the plan with the highest and the lowest complexity, simulated with 25 mm amplitudes and 25 breaths. High plan complexity influenced the dose distribution inside the PTV, whereas, with reduced complexity, the failing points were outside the PTV.
The dose errors for the patient with the lowest NBs depict the interplay in a single fraction. Although the effect after eight fractions is likely to be averaged out, this raises the question of interplay for single-fraction SF-SABR treatments where no averaging is possible. The interplay dosimetric errors for the single fraction of a SABR treatment were studied by Gauer et al., 2019. In their work, the influence of the motion period was considered using a sinusoidal motion of 6 s. Edvardson et al. (2018) showed higher interplay dose discrepancies with FFF beams Reference Edvardsson, Nordström, Ceberg and Ceberg5 . With SF-SABR plans, the dose per fraction would be typically higher Reference Fernández, Navarro-Martin and Bobo39 , which would result in changes in plan properties such as MLC speed and delivery time, which can have an effect on the interplay effect.
Motion management solutions in lung SABR are utilised to limit the size of the irradiated volume (PTV) and the dose to the organ at risk. For high motion amplitudes and low NBs, the use of motion management solutions can generate a small PTV and reduce the extent of motion (e.g., gating, breath hold). As a result of motion management, the associated interplay effect is also expected to reduce. Improved SI dose profiles were reported for gated-VMAT SABR compared with non-gated VMAT SABR, along with a 50% reduction in PTV. Similar D95% and D2% between gated and non-gated deliveries were also reported Reference Olding and Alexander6 .
The interplay simulation-based assessment is an alternative to sole measurement-based quantification using a moving platform, in which a range of breathing characteristics and radiation delivery parameters can be examined. Some approaches involve multiple steps and the use of several programmes, which may limit their implementation in clinics. The tool presented in this work has important implications as it is clinic-friendly and requires less invasive work. In comparison to other (1D motion) simulation approaches published in the literature Reference Edvardsson, Nordström, Ceberg and Ceberg5,Reference Edvardsson, Scherman and Nilsson9 , the tool exploited here requires fewer programmes and fewer steps to obtain the simulation. It also allows the simulation of 3D translational and 3D rotational target motion, which are currently being investigated in our institution.
One limitation of this work is that the simulated motion is a 1D sinusoidal motion that mimics a regular breathing pattern. However, real patient breathing is a 3D motion with a range of irregularities. More work is still needed to develop robust simulation methods that consider clinics, devices and patient differences in quantifying the interplay effect. Tools that are simulation-based without the requirement of measurement are emerging Reference von Münchow, Straub and Losert40 and it is acknowledged that these solutions could further streamline the process of patient-specific determination of interplay effect. These solutions will help ensure that dose errors are minimised by finding alternative motion management and treatment options where there is the potential for dosimetric errors to compromise the treatment goals.
Conclusion
This work has demonstrated the effect of the interplay effect with a range-of-motion amplitudes and NBs along with a variety of plan features. The utilised simulation tool offers the assessment of the interplay effect over a wide range of breathing characteristics and range of scenarios. This would require excessive time and workload if phantom measurements were considered for each scenario. Moreover, the large extent of the simulated motion amplitudes and NBs increases the reliability of the results, which in turn enhances the interplay effect management in practice. The simulations indicated high dose discrepancies for long breathing periods (reduced NBs) and large breathing amplitudes. The interplay effect was not evident for high NBs regardless of the motion amplitude. Neither the plan complexity score nor the PTV size influenced the interplay effect.
Motion management solutions should be investigated for SABR patients demonstrating dosimetric errors due to the interplay effect using this simulation tool. It is recommended that vendors develop a simulation tool with anatomical information that is suitable for routine clinical practice to improve patient-specific interplay evaluation.
Supplementary material
To view supplementary material for this article, please visit https://doi.org/10.1017/S146039692300033X.
Acknowledgements
-
1. Bernd Allgaier (PTW-Freiburg, Germany) for the provided scientific support.
-
2. The Friends of the Cancer Centre organisation (Northern Ireland Cancer Centre, Belfast) for funding Dr Varasteh during this project.
-
3. Royal Embassy of Saudi Arabia Cultural Bureau, London for funding Asmaa Ali.
Financial support
The Friends of the Cancer Centre organisation (Northern Ireland Cancer Centre, Belfast) for funding.
Competing interests
There are no conflicts of interest.


 Open access