


Introduction
Much of the past effort in arctic applications of infrared sensing has been directed toward sea-ice reconnaissance (Reference AndersonAnderson, 1962; Reference PoulinPoulin and others, 1962; Reference McLerranMcLerran, 1965; Reference Poulin and HarwoodPoulin, 1965; Reference Ketchum and WittmannKetchum and Wittmann, 1966; Poulin and Harwood, 1966; Reference Kuhn and GloersenKuhn and others, 1973). These works have shown that relative ice thicknesses can usually be identified; new, young, first-year, and multi-year ice can often be delineated as such; cracks and pressure ridges can be distinguished, and various other ice characteristics can be determined. Kuhn and others (1973) indicate that it may be possible to estimate ice thickness with an accuracy of ±0.3 m.
The accuracy to which it is necessary to know the thickness of sea or fresh ice depends on the type of ice and the operational circumstances involved. Whereas the captain of a large icebreaker may consider it sufficient to distinguish between first-year or multi-year ice, that of a smaller ship may need to know whether or not the ice is thicker than some critical limit, Other persons may find a difference of a few centimeters to be significant, even in relatively thick ice. Therefore, it is difficult to say how accurate a method of ice thickness determination ought to be. Although an accuracy of 5 to 10% may be desired, one of 20 to 30% would certainly be useful. It is doubtful whether even the latter accuracy can be achieved on the basis of surface temperature measurements alone.
Some aspects of sea ice make it an excellent subject for infrared sensing. For example, its lower surface terminates at a nearly constant temperature regardless of ice thickness or geographical distribution; disturbances in the ice sheet are subject to sharp thermal contrasts with respect to the rest of the ice sheet; compared to other terrain materials, the thermal conductivity of sea ice varies within a relatively narrow range; much of the “ice season” is characterized by low light levels or total darkness; and, generally speaking, there is relatively-little extraneous subject matter, or background, to contend with. However, the complexities of weather and the dynamics of the sea provide a host of variables that can confuse the interpretation of sea-ice imagery. Snow cover, which varies with the age of the ice as well as weather conditions, is a particularly bothersome factor, and the relative influence of a given thickness of snow is itself dependent on the thickness of the ice it is covering. One cannot always be sure, therefore, that thin ice will radiate more than thick ice, that a given ice condition will exhibit a given radiation contrast, or that low thermal contrast means a nearly uniform ice thickness. Nevertheless, thermal imagery can be an excellent source of ice information, if, as with any other image form, one becomes aware of its limitations. This is particularly-true when one attempts quantitative evaluation of the infrared radiance from the surface, even if adequate corrections can be made for atmospheric transmission between the surface and the sensor.
There are two cases to be considered in the evaluation of the apparent surface radiance. Case one is that in which the radiometer’s effective, instantaneous field of view is small enough to resolve significantly different areas, such as those composed of different ice types, different amounts of snow cover, cracks, leads, etc.: the high-resolution case. Case two is that in which these individual areas are not resolved: the low-resolution case. In this latter case the instantaneous measured irradiance is proportional to the summation of the products of the fractional areas Ai and the fourth power of their surface temperatures Ti .
This condition does not provide any information about the individual, small areas, and an image thus produced depicts only major boundaries between large areas for which homogeneity must be defined in a manner consistant with the field of view, such as a uniform percentage of ice cover or a uniform ice thickness. Generally, snow thickness varies significantly over short distances and on ice of different ages, thus requiring relatively high resolution for delineation of small areas of different ice type and snow depth. The discussion which follows is limited to the high-resolution case.
Thermal Characteristics of Snow-Covered Ice
Off-hand one might suppose that, since the bottom of the ice stays at a constant, known temperature, and all the ice in a given locality is subject to essentially the same environment, surface temperatures should be indicative of ice thickness, which, of course, it is. But surface temperature is also dependent on a number of other factors that fall into two categories: (1) thickness and density of the snow cover, and (2) changing meteorological conditions. Either of these factors may supersede ice thickness as the dominant influence on surface temperature.
Snow on sea ice is commonly wind-blown and has a density of the order of 0.4 Mg m-3 and a thermal conductivity of approximately 0.46 W m-1 deg-1. However, the density may vary within a nominal range from 0.1 to 0.5 Mg m-3 with an associated conductivity ranging from about 0.07 to 0.8 W m-1 deg-1. Comparing these values with those for sea ice (approximately 1.3 to 2.2 W m-1 deg-1. shows that the ratio of conductivity for ice to that of snow may vary from about 1.6 to 31. Moreover, it is not unusual for there to be more than one layer of snow, particularly on ice that is a few months old. In this time considerable metamorphism occurs, and a variously thick layer of depth hoar is not uncommon. Thus, instead of a two-layer system it may be more appropriate to consider that one is dealing with at least a three-layer system, in which the conductivity of two layers and the thickness of all three layers is unknown. (It would be appropriate, under the circumstances, to assume a constant, single value of conductivity for the ice, or at least for each type—first-year, multi-year, etc.). Obviously, such a system cannot be solved on the basis of the single variable of surface temperature. One might assume a single layer of snow at some average density, but that still leaves the variable of snow depth. Il is interesting, therefore, to examine the steady-stale heal flow of such a two-layer system—realizing, of course, that steady state is another gross assumption.
The equation for steady state, one-dimensional heat flow Fe due to conduction through a two-layer system may be written in the form

where (T1 — T 2) is the temperature difference between the two outer surfaces, k1 the thermal conductivity of the first layer (ice), Z1 the thickness of the first layer (ice), a the ratio of thermal conductivity of layer 2 to that of layer 1, and b the ratio of thickness of layer 2 to that of layer 1. The quantity a/(a+b) is thus the ratio of the heat conducted through the two layers to that conducted through a single layer system for the same total temperature difference. For a unit temperature difference through snow-covered ice
where the subscript i signifies the ice layer and a is now the ratio of the thermal conductivity of snow to that of ice ks/kI and b is now the ratio of snow depth to ice thickness ZsZi This relationship is presented graphically in Figure 1 for the case of ki = 2.1 W m-1 deg-1 and for snow densities from 0.1 to 0.5 Mg m-3. The curves show how rapidly and non-linearly snow depth influences the heat flow through two layers with respect to ice without snow, and how strong the influence of snow density is.
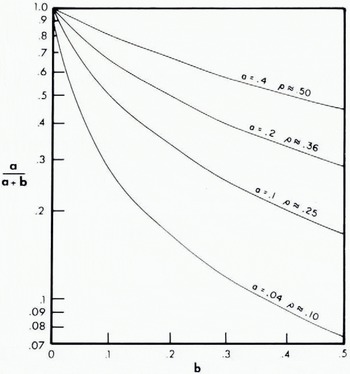
Fig. 1. Relative, steady-state, heat conduction through snow-covered sea ice assuming the thermal conductivity of ice constant at 2.1 W m-1 deg-1. The ratio of snow to ice conductivity is represented by the symbol a; b is the ratio of snow depth to ice thickness; and p is the approximate snow density corresponding to the value of a in Mg m-3 .
Under the influence of a variable and unknown energy exchange at the snow surface {non-steady state) the relationships between the conducted heat flux (or surface temperature) and ice thickness become even more variable and indeterminate. An additional point is the fact that heat transfer in snow is not a simple function of density. Yosida (1960) concluded that vapor diffusion is independent of snow density. Thus, as Reference YenYen (1969) notes, vapor diffusion is a major factor for heat transfer in low-density snow.
It seems reasonable, therefore, to conclude that it is futile to attempt an evaluation of absolute ice thickness from surface temperature alone, that is without supplementary data. It may be more appropriate to consider the possibility of using surface temperature as an indicator of snow depth in an area of relatively uniform ice thickness and where it is possible to make at least a few measurements of snow properties. With the idea that a demonstration of a relationship between surface temperature and snow depth tends to confirm the conclusion stated above on the relationship between surface temperature and ice thickness, the following data are presented.
Snow Depth From Surface Temperature
Incidental to a study of temperature variations of frozen shore lines during the winter and early spring of 1969, the opportunity arose to make measurements concerning the surface temperature of the nearby sea ice. Figure 2 is an 8-14 μm aerial radiometric trace from sea ice on Kugmallit Bay in the Mackenzie Delta area on 22 April 1969. Nine measurements of ice thickness made from about 1 to 6 km from shore had a mean of 1.79 m and a standard deviation of 0.13 m, indicating that the bay ice had a reasonably uniform thickness—certainly not enough to account for the variations shown in Figure 2. Also, visual observation from the aircraft confirmed a definite relationship with snow cover, as numerous bare spots and thin snow areas could be immediately correlated with the trace on the chart recorder.
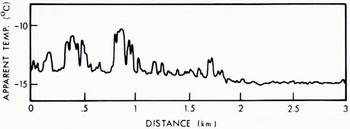
Fig. 2. Radiometric trace {8-14 μm) from an altitude of 130 m over Kugmallit Bay, 20.30 h local time, 22 April 1969. Sunset was at 20.00 h. The wind was calm to very light; the sky was fairly clear overhead but hazy to the sides; and the surface air (screen) temperature was - 13º. Apparent temperature variations are due mainly to variations of snow depth. Warmest values are for bare ice.
Figure 3 is a plot of radiometric surface temperature and snow depth measurements made on Kugmallit Ray and an adjacent lagoon in April 1969. The measurements were made between 02.30 and 04.30 P.S.T. with a Barnes PRT-5 radiometer; sunrise (upper edge of sun visible) was at 03.40 h, The wind was light to calm, the sky was clear, and the air temperature was —12º C one meter above the surface and approximately —15ºC near the surface, a rather strong radiational condition. In addition to showing the snow depth, Figure 3 shows the ratio of snow depth to average ice thickness, taken as 180 cm. The surface temperature measurements are shown as the difference between (he measured temperature T and the air temperature near the surface, ΔT= T—(—15° C), and as the ratio of the measured temperature to the near-surface air temperature, R = T/—15° C. The snow density was 0.4 Mg m-3. Four pairs of points are connected by straight lines. These are points where the surface temperature was measured for two different snow depths at a single location, thereby tending to eliminate the variation due to ice thickness. Note the general parallelism between these line segments and the dashed curve. The horizontal lines at various points represent the effect of ±13 cm (one standard deviation) ice thickness on the ratio b of snow depth to ice thickness. They are strictly a function of snow depth, and in the interest of clarity they are not shown for all points.
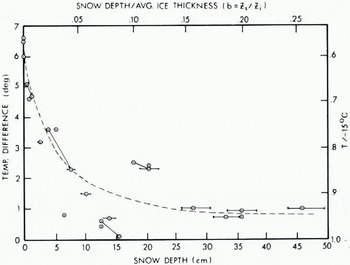
Fig. 3. Difference, between radiometric surface temperature T and air temperature near the surface,— 15º C, versus snow depth on sea ice on Kugmallil Bay near Tuktoyaktuk, N.W.T., 28 April 1969·
Considering that the accuracy of the temperature measurements was about 0.5 deg and that the snow depths were measured to the nearest 0.5 cm, the scatter in the data is probably indicative of actual temperature variations that occur on such surfaces, possibly as a secondary effect of the variable snow depth. The morphology of the snow cover, for instance, in conjunction with the air temperature inversion near the surface, can be expected to be a significant cause of temperature variations, particularly in the presence of air currents induced by a light wind. The steeper surfaces of small, deep drifts are subject to relatively large temperature changes in short distances compared to large drifts with gentle slopes, and as indicated above, the inversion gradient during measurement of the Figure 3 data was 3 deg m-1. Thus, the data presented here are hardly sufficient to justify an elaborate mathematical analysis. However, (hey do appear indicative of a significant relationship between surface temperature and snow- depth, which is consistent with the data shown in Figure 2 and with numerous observations made in the past on thermal infrared imagery.
The dashed curve shown in Figure 3 was drawn by eye, and the reader may well prefer a somewhat different curve, but the conclusion concerning the interdependence between surface temperature and snow depth would remain unchanged. Indeed, the true shape of such a curve, being dependent on current and recent environmental conditions, can be expected to vary considerably. For example, the maximum range of surface temperature, regardless of snow depth, depends on the air temperature, which sels the nominal lower limit. and the degree of deviation from a steady-state heat flow condition will also be influential. In this latter regard, subsurface temperature profiles measured at a nearby instrumented site indicated that the data shown in Figure 3 were obtained under conditions that deviated sharply from steady state.
Conclusions
-
1. Although relative radiance values, particularly when supported with surface observations, may be useful for mapping relative ice thicknesses, surface temperature atone is unreliable as an absolute indicator of ice thickness to the accuracy usually required for navigation purposes because, primarily, of the complications resulting from snow cover.
-
2. The dominant role of a snow cover suggests that it may be more appropriate to consider mapping snow distribution from surface temperature rather than ice thickness given the condition of a relatively uniform ice thickness, such as might be found on a bay, lagoon, or lake. However, further studies will be required to prove such an application.
Discussion
D. BAJZAK.: I would like to make some remarks regarding instrumentation of infrared sensing:
-
(1) These instruments indicate surface temperature of a target which completely fills the instantaneous field of view. Therefore, the structure and texture of the object (target) has a significant bearing on the measured temperature.
-
(2) The ambient temperature of the sensing head has an effect on the accuracy of measurement.
-
(3) These instruments do not really measure the surface temperature as manufacturers claim.
-
(4) The production of imagery is achieved through the use of a glow bulb. These bulbs vary from one to another, therefore two different instruments can produce markedly different images of the same terrain.
S. I. OUTCALTS: All imaging systems are not the same. It is possible to make direct use of the analog data on magnetic tape. Also the color-slicing procedure, if done with the original data, helps in picking out detailed thermal patterns.
P. GLOERSEN: I would like to point out some work carried out in the U.S.A.-U.S.S.R. Bering Sea Experiment (BESEX) regarding ice thickness determinations in refrozen leads with little or no snow cover. A combination of surface temperature measurements (by thermal infrared, 11 μιτι band) and air temperature measurements (from aircraft instruments) were used. Some limited success was achieved in the ice thickness range 0-50 cm, as determined by surface-truth measurements. This work is reported in the proceedings of the BESEX Symposium, Leningrad, May 1974. (Also as NASA/GSFC X-910-74-141, June 1974).
W. D. HIBLER, III: The albedos of thin ice, thick first-year ice, and multi-year ice are often quite different. This albedo change will change the heat absorption and hence modify the surface temperature, perhaps even at night because of the time needed to come to equilibrium. Is this a major factor?
A. O. POULIN: The major factor is the air temperature near the surface, but non-equilibrium effects due to, say, albedo changes may be important.
OUTCALT: Our simulations show that albedo variations do cause significant changes in surface temperatures and hence must be considered in modelling.
J. F. NYE: I believe there is often a whole spectrum of ice thickness within one resolution element of a sensing instrument. For applications it may often not be the average thickness that is needed but some highly-weighted average. For example, if ice deformation is being studied, it is the thinnest categories that are most important. 1 am not sure what sort of average the captain of an icebreaker would like to know. In short, should one put so much emphasis on trying to observe the unweighted average value itself?
C. W. M. SWITHINBANK: Icebreaker captains basically need to know how much thin ice there is. but not exactly how thin it is.
D. F. PAGE: Oil companies need somewhat betler accuracy because they want the ice to be thick enough to put trucks onto.
E. L. LEWIS: My experience has shown that snow cover is generally far from constant in strong winds, and may change markedly. This is relevant if snow thickness is needed to estimate ice thickness. In addition prevalent wind directions greatly affect snow deposit densities in coastal regions and ice thickness variations up to 30% have been observed beneath equal snow-cover depths.
POULIN: Surface homogeniety (such as areas of uniform thickness) must be defined in a manner consistent with the size of the resolution element of the sensing instrument, keeping in mind that the radiance observed in one resolution element is only one piece of data. If there are two or more unknown factors contributing to the radiance in one resolution element and these factors need to be determined, then additional data about the area is required, i.e. better resolution.
In the case of a thermal infrared image, the radiance recorded by one resolution element is, in fact, a weighted average value—weighted by the temperature of each “homogeneous” area that is in the overall area observed by the resolution element. If one needs a particular weighted average, such as a weighted average thickness, he must determine the particular weighting factors that are appropriate for his purpose and apply it to each area of a given thickness as determined (estimated) by a sensing instrument of appropriate resolution.
The point of my paper is that, given uniform conditions within a resolution element, one is still hard pressed to determine thickness from the infrared radiance. But 1 think that if we can simply identify ice type, and therefore general thickness ranges, we can satisfy a large percentage of the needs in this area.


