1 Introduction
High-power narrow-linewidth nanosecond lasers are desired in a range of applications such as coherent LIDAR[Reference Lee, Geng, Jiang and Yu1, Reference Zhang, Diao, Liu, Zhu, Yang, Liu, Hou and Chen2] and nonlinear frequency conversion[Reference Liu, Norsen and Mead3–Reference Shi, Leigh, Zong, Yao, Nguyen, Chavez-Pirson and Peyghambarian5]. All-fiber monolithic configuration, which has the unique advantages of robustness, compactness and low maintenance, can offer a perfect solution to those applications. High-power narrow-linewidth fiber lasers are mostly based on the master oscillator power amplifier (MOPA) architecture, which typically consists of a low- or medium-power laser seed followed by one or several high-power fiber amplifiers[Reference Richardson, Nilsson and Clarkson6–Reference Yang, Xu, Yang, Lin, Mo, Li, Feng, Chen, Yang and Jiang9]. Pulsed laser seeds with transform-limited linewidths can be generated by directly
![]() $Q$
-switching a distributed Bragg reflector single-frequency fiber laser[Reference Geng, Wang, Jiang, Luo, Jiang and Czarnecki10, Reference Leigh, Shi, Zong, Wang, Jiang and Peyghambarian11] or modulating a CW single-frequency fiber laser[Reference Fang, Shi, Petersen, Khanh, Chavez-Pirson and Peyghambarian12, Reference Su, Wang, Zhou and Xu13]. The power-scaling of the narrow-linewidth fiber amplifier is mainly limited by stimulated Brillouin scattering (SBS)[Reference Su, Zhou, Wang, Lü and Xu14, Reference Kobyakov, Sauer and Chowdhury15]. Over the past decade, many techniques have been employed to mitigate SBS and increase the output power, such as using large mode area (LMA) and/or highly doped active fiber[Reference Lee, Geng, Jiang and Yu1, Reference Fang, Shi, Petersen, Khanh, Chavez-Pirson and Peyghambarian12], imposing thermal and/or strain distributions[Reference Hildebrandt, Büsche, Weßels, Frede and Kracht16–Reference Zhang, Cui, Liu, Zhou and Feng18], and designing acoustic wave tailored fibers[Reference Robin, Dajani and Pulford19, Reference Li, Chen, Wang, Gray, Liu, Demeritt, Ruffin, Crowley, Walton and Zenteno20]. In the pulsed regime, the SBS threshold also depends on the pulse width because the response of the medium in the SBS case is governed by a phonon lifetime of several nanoseconds[Reference Su, Zhou, Wang, Lü and Xu21, Reference Agrawal22]. By using highly Tm-doped germanate fiber with a length of
$Q$
-switching a distributed Bragg reflector single-frequency fiber laser[Reference Geng, Wang, Jiang, Luo, Jiang and Czarnecki10, Reference Leigh, Shi, Zong, Wang, Jiang and Peyghambarian11] or modulating a CW single-frequency fiber laser[Reference Fang, Shi, Petersen, Khanh, Chavez-Pirson and Peyghambarian12, Reference Su, Wang, Zhou and Xu13]. The power-scaling of the narrow-linewidth fiber amplifier is mainly limited by stimulated Brillouin scattering (SBS)[Reference Su, Zhou, Wang, Lü and Xu14, Reference Kobyakov, Sauer and Chowdhury15]. Over the past decade, many techniques have been employed to mitigate SBS and increase the output power, such as using large mode area (LMA) and/or highly doped active fiber[Reference Lee, Geng, Jiang and Yu1, Reference Fang, Shi, Petersen, Khanh, Chavez-Pirson and Peyghambarian12], imposing thermal and/or strain distributions[Reference Hildebrandt, Büsche, Weßels, Frede and Kracht16–Reference Zhang, Cui, Liu, Zhou and Feng18], and designing acoustic wave tailored fibers[Reference Robin, Dajani and Pulford19, Reference Li, Chen, Wang, Gray, Liu, Demeritt, Ruffin, Crowley, Walton and Zenteno20]. In the pulsed regime, the SBS threshold also depends on the pulse width because the response of the medium in the SBS case is governed by a phonon lifetime of several nanoseconds[Reference Su, Zhou, Wang, Lü and Xu21, Reference Agrawal22]. By using highly Tm-doped germanate fiber with a length of
![]() ${\sim}$
25 cm, narrow-linewidth nanosecond fiber lasers with 33 kW peak powers have been obtained[Reference Fang, Shi, Petersen, Khanh, Chavez-Pirson and Peyghambarian12].
${\sim}$
25 cm, narrow-linewidth nanosecond fiber lasers with 33 kW peak powers have been obtained[Reference Fang, Shi, Petersen, Khanh, Chavez-Pirson and Peyghambarian12].
The spectral linewidth of laser pulses broadens in fiber amplifiers because of self-phase modulation (SPM), which degrades the coherence of the laser and influences its performance. For example, the linewidth of a 1 kW peak power pulsed laser broadened from 50 MHz to 150 MHz after propagating in 3 m long SMF-28 fiber[Reference Geng, Wang, Jiang, Luo, Jiang and Czarnecki10]. In order to reduce the undesired SPM, a promising way is using LMA and/or highly doped active fiber[Reference Fang, Shi, Petersen, Khanh, Chavez-Pirson and Peyghambarian12, Reference Shi, Petersen, Nguyen, Yao, Chavez-Pirson, Peyghambarian and Yu23]. For fiber laser systems including longer passive fibers, SPM-induced spectral broadening cannot be neglected[Reference Geng, Wang, Jiang, Luo, Jiang and Czarnecki10]. Since the spectral broadening is induced by a time-dependent nonlinear phase shift, it can be eliminated if the nonlinear phase shift is compensated by phase modulation of the laser. However, a complex phase modulation system is required, and the compensation effect is limited by the phase modulation depth and pulse shape of the driving signal[Reference Xu, Mollenauer and Liu24–Reference Su, Zhou, Ma, Lü and Xu26].
In this paper, we demonstrate the impact of pulse shape on SPM-induced spectral broadening. The numerical and experimental results show that the spectrum of a square-shape pulsed laser is theoretically immune to SPM-induced spectral broadening. By using a square-shape laser seed, linearly polarized nanosecond pulses with transform-limited linewidths and peak powers of several kilowatts were obtained.
2 Impact of pulse shape on SPM
SPM induces a temporally dependent phase shift. The nonlinear phase shift of the laser pulse from the fiber can be expressed as
where
![]() $I(t)$
is the normalized intensity,
$I(t)$
is the normalized intensity,
![]() $B=\unicode[STIX]{x1D6FE}L_{\text{eff}}P_{\text{peak}}$
is the
$B=\unicode[STIX]{x1D6FE}L_{\text{eff}}P_{\text{peak}}$
is the
![]() $B$
-integral,
$B$
-integral,
![]() $P_{\text{peak}}$
is the peak power of the laser pulse,
$P_{\text{peak}}$
is the peak power of the laser pulse,
![]() $\unicode[STIX]{x1D6FE}=n_{2}(\unicode[STIX]{x1D708}_{0})2\unicode[STIX]{x03C0}\unicode[STIX]{x1D708}_{0}/cA_{\text{eff}}$
is a nonlinear parameter,
$\unicode[STIX]{x1D6FE}=n_{2}(\unicode[STIX]{x1D708}_{0})2\unicode[STIX]{x03C0}\unicode[STIX]{x1D708}_{0}/cA_{\text{eff}}$
is a nonlinear parameter,
![]() $n_{2}(\unicode[STIX]{x1D708}_{0})$
is the nonlinear-index coefficient,
$n_{2}(\unicode[STIX]{x1D708}_{0})$
is the nonlinear-index coefficient,
![]() $A_{\text{eff}}$
is the effective mode area, and
$A_{\text{eff}}$
is the effective mode area, and
![]() $L_{\text{eff}}$
is the effective length. For a pulsed fiber laser, the temporally varying intensity induces a temporally changed phase. Therefore, the instantaneous optical frequency differs across the pulse from its central value
$L_{\text{eff}}$
is the effective length. For a pulsed fiber laser, the temporally varying intensity induces a temporally changed phase. Therefore, the instantaneous optical frequency differs across the pulse from its central value
![]() $\unicode[STIX]{x1D708}_{0}$
, and the time dependence of
$\unicode[STIX]{x1D708}_{0}$
, and the time dependence of
![]() $\unicode[STIX]{x1D6FF}\unicode[STIX]{x1D708}$
is
$\unicode[STIX]{x1D6FF}\unicode[STIX]{x1D708}$
is
We can find from Equation (2) that new frequency components are generated because of the temporal intensity change of the laser pulse. For an unchirped narrow-linewidth laser pulse, these SPM-generated frequency components lead to spectral broadening. The broadened spectrum is given by Ref. [Reference Agrawal22]:
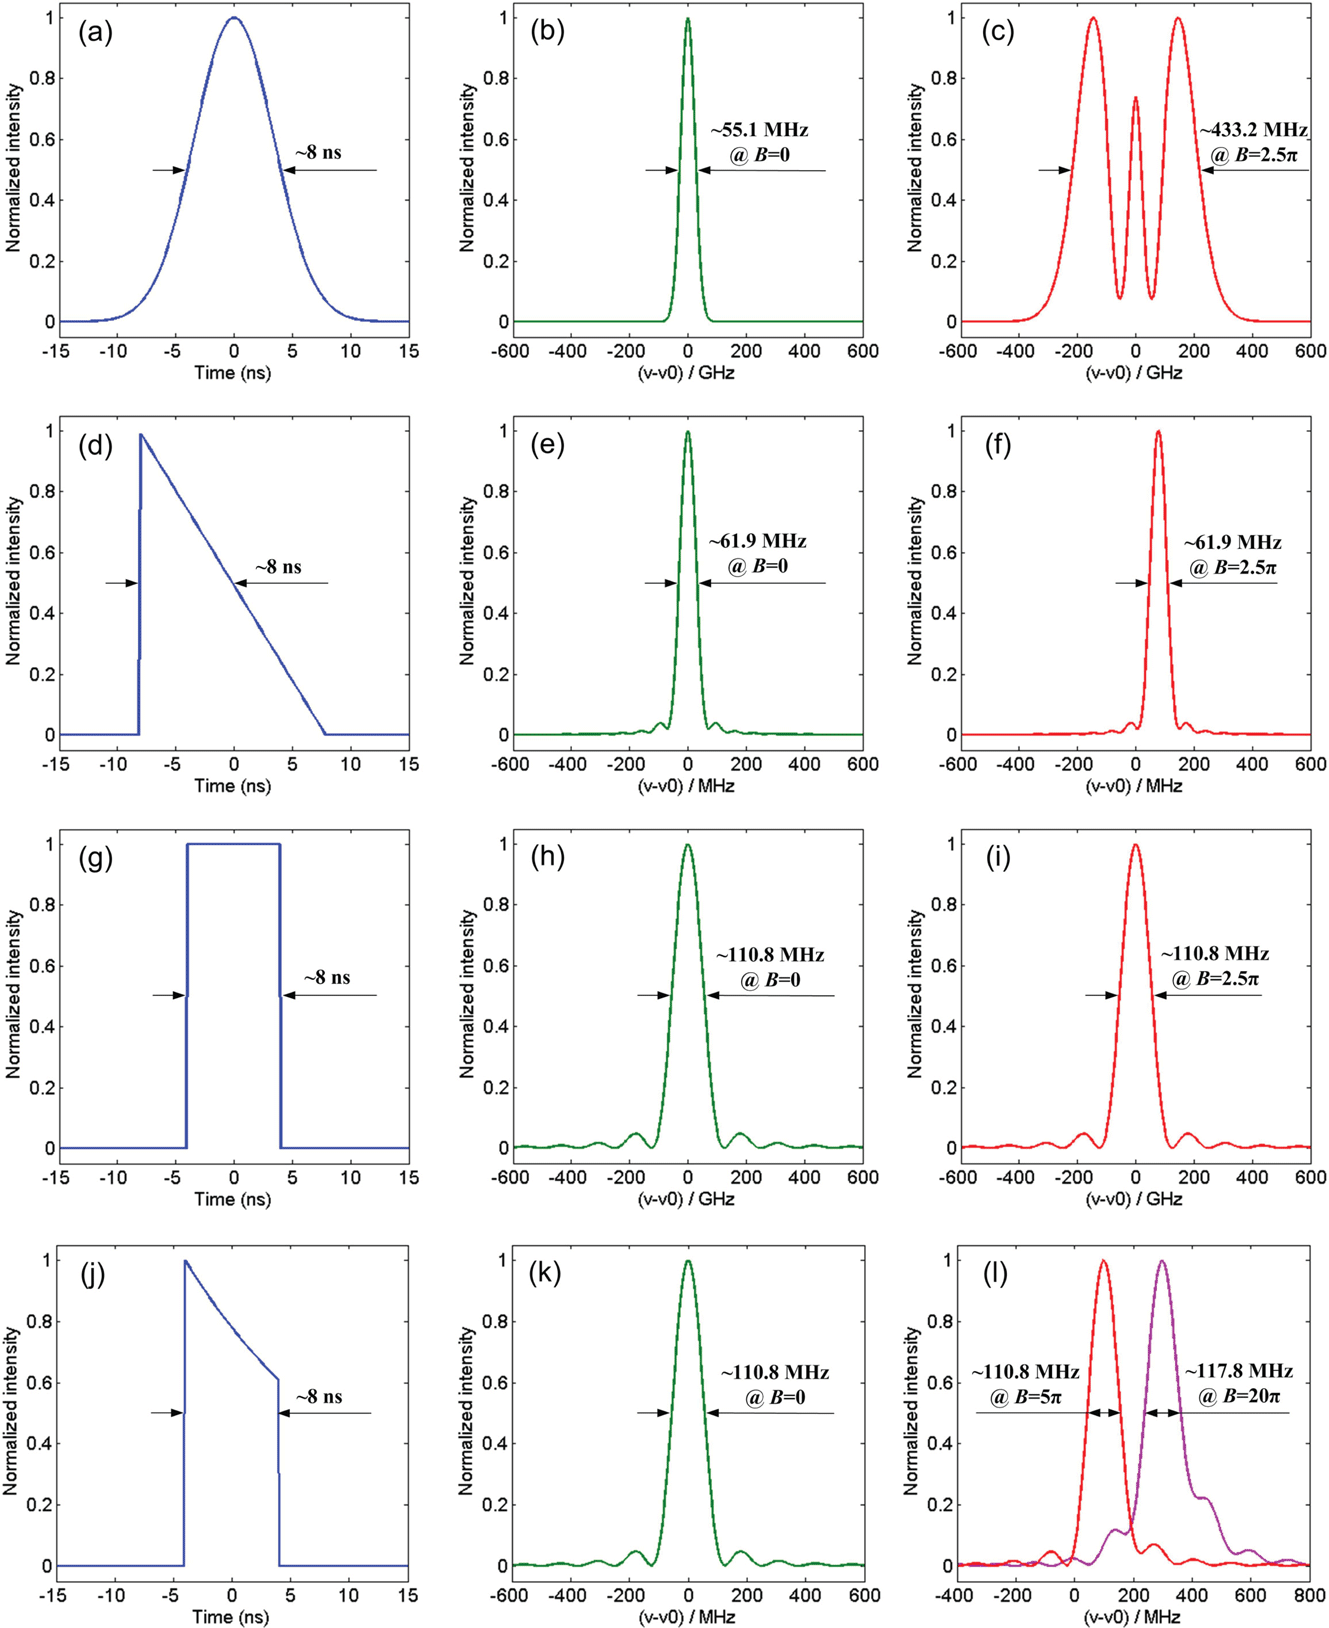
It is easily seen that the pulse shape will influence the broadened spectrum. Here we will numerically analyze the impact of the pulse shape. In the numerical calculations, we employed laser pulses with Gaussian, sawtooth, square and distorted square shapes. Figures 1(a), 1(d), 1(g) and 1(j) show the pulse shapes. In this paper, pulse width and linewidth are all defined as full-width at half-maximum (FWHM). Here the pulse widths were all set to be 8 ns. The corresponding spectra are shown in Figures 1(b), 1(e), 1(h) and 1(k) when
![]() $B=0$
, and Figures 1(c), 1(f), 1(i) and 1(l) show the corresponding spectra when
$B=0$
, and Figures 1(c), 1(f), 1(i) and 1(l) show the corresponding spectra when
![]() $B\neq 0$
. For a Gaussian-shape laser pulse, the linewidth broadened from
$B\neq 0$
. For a Gaussian-shape laser pulse, the linewidth broadened from
![]() ${\sim}55.1$
MHz to
${\sim}55.1$
MHz to
![]() ${\sim}433.2$
MHz when
${\sim}433.2$
MHz when
![]() $B$
increased from 0 to 2.5
$B$
increased from 0 to 2.5
![]() $\unicode[STIX]{x03C0}$
, as shown in Figures 1(b) and 1(c). However, the linewidth for the sawtooth-shape laser pulse did not change when
$\unicode[STIX]{x03C0}$
, as shown in Figures 1(b) and 1(c). However, the linewidth for the sawtooth-shape laser pulse did not change when
![]() $B$
increased from 0 to 2.5
$B$
increased from 0 to 2.5
![]() $\unicode[STIX]{x03C0}$
, as shown in Figures 1(e) and 1(f). The reason is that
$\unicode[STIX]{x03C0}$
, as shown in Figures 1(e) and 1(f). The reason is that
![]() $\unicode[STIX]{x2202}I(t)/t$
has a constant value of
$\unicode[STIX]{x2202}I(t)/t$
has a constant value of
![]() $-1/16$
for a sawtooth-shape pulse, as shown in Figure 1(d) – that is,
$-1/16$
for a sawtooth-shape pulse, as shown in Figure 1(d) – that is,
![]() $\unicode[STIX]{x1D6FF}\unicode[STIX]{x1D708}(t)$
is also a constant and the spectrum shape does not change. We can find from Figure 1(f) that the central frequency shifted by 78.1 MHz, which is equal to the value of Equation (2) when
$\unicode[STIX]{x1D6FF}\unicode[STIX]{x1D708}(t)$
is also a constant and the spectrum shape does not change. We can find from Figure 1(f) that the central frequency shifted by 78.1 MHz, which is equal to the value of Equation (2) when
![]() $B=2.5\unicode[STIX]{x03C0}$
and
$B=2.5\unicode[STIX]{x03C0}$
and
![]() $\unicode[STIX]{x2202}I(t)/t=-1/16$
. The value of
$\unicode[STIX]{x2202}I(t)/t=-1/16$
. The value of
![]() $\unicode[STIX]{x2202}I(t)/t$
is zero for a square-shape pulse, which means
$\unicode[STIX]{x2202}I(t)/t$
is zero for a square-shape pulse, which means
![]() $\unicode[STIX]{x1D6FF}\unicode[STIX]{x1D708}(t)=0$
even if
$\unicode[STIX]{x1D6FF}\unicode[STIX]{x1D708}(t)=0$
even if
![]() $B\neq 0$
. Therefore, there was no spectral change and shift for the square-shape pulse when
$B\neq 0$
. Therefore, there was no spectral change and shift for the square-shape pulse when
![]() $B$
increased from 0 to 2.5
$B$
increased from 0 to 2.5
![]() $\unicode[STIX]{x03C0}$
, as shown in Figures 1(h) and 1(i).
$\unicode[STIX]{x03C0}$
, as shown in Figures 1(h) and 1(i).
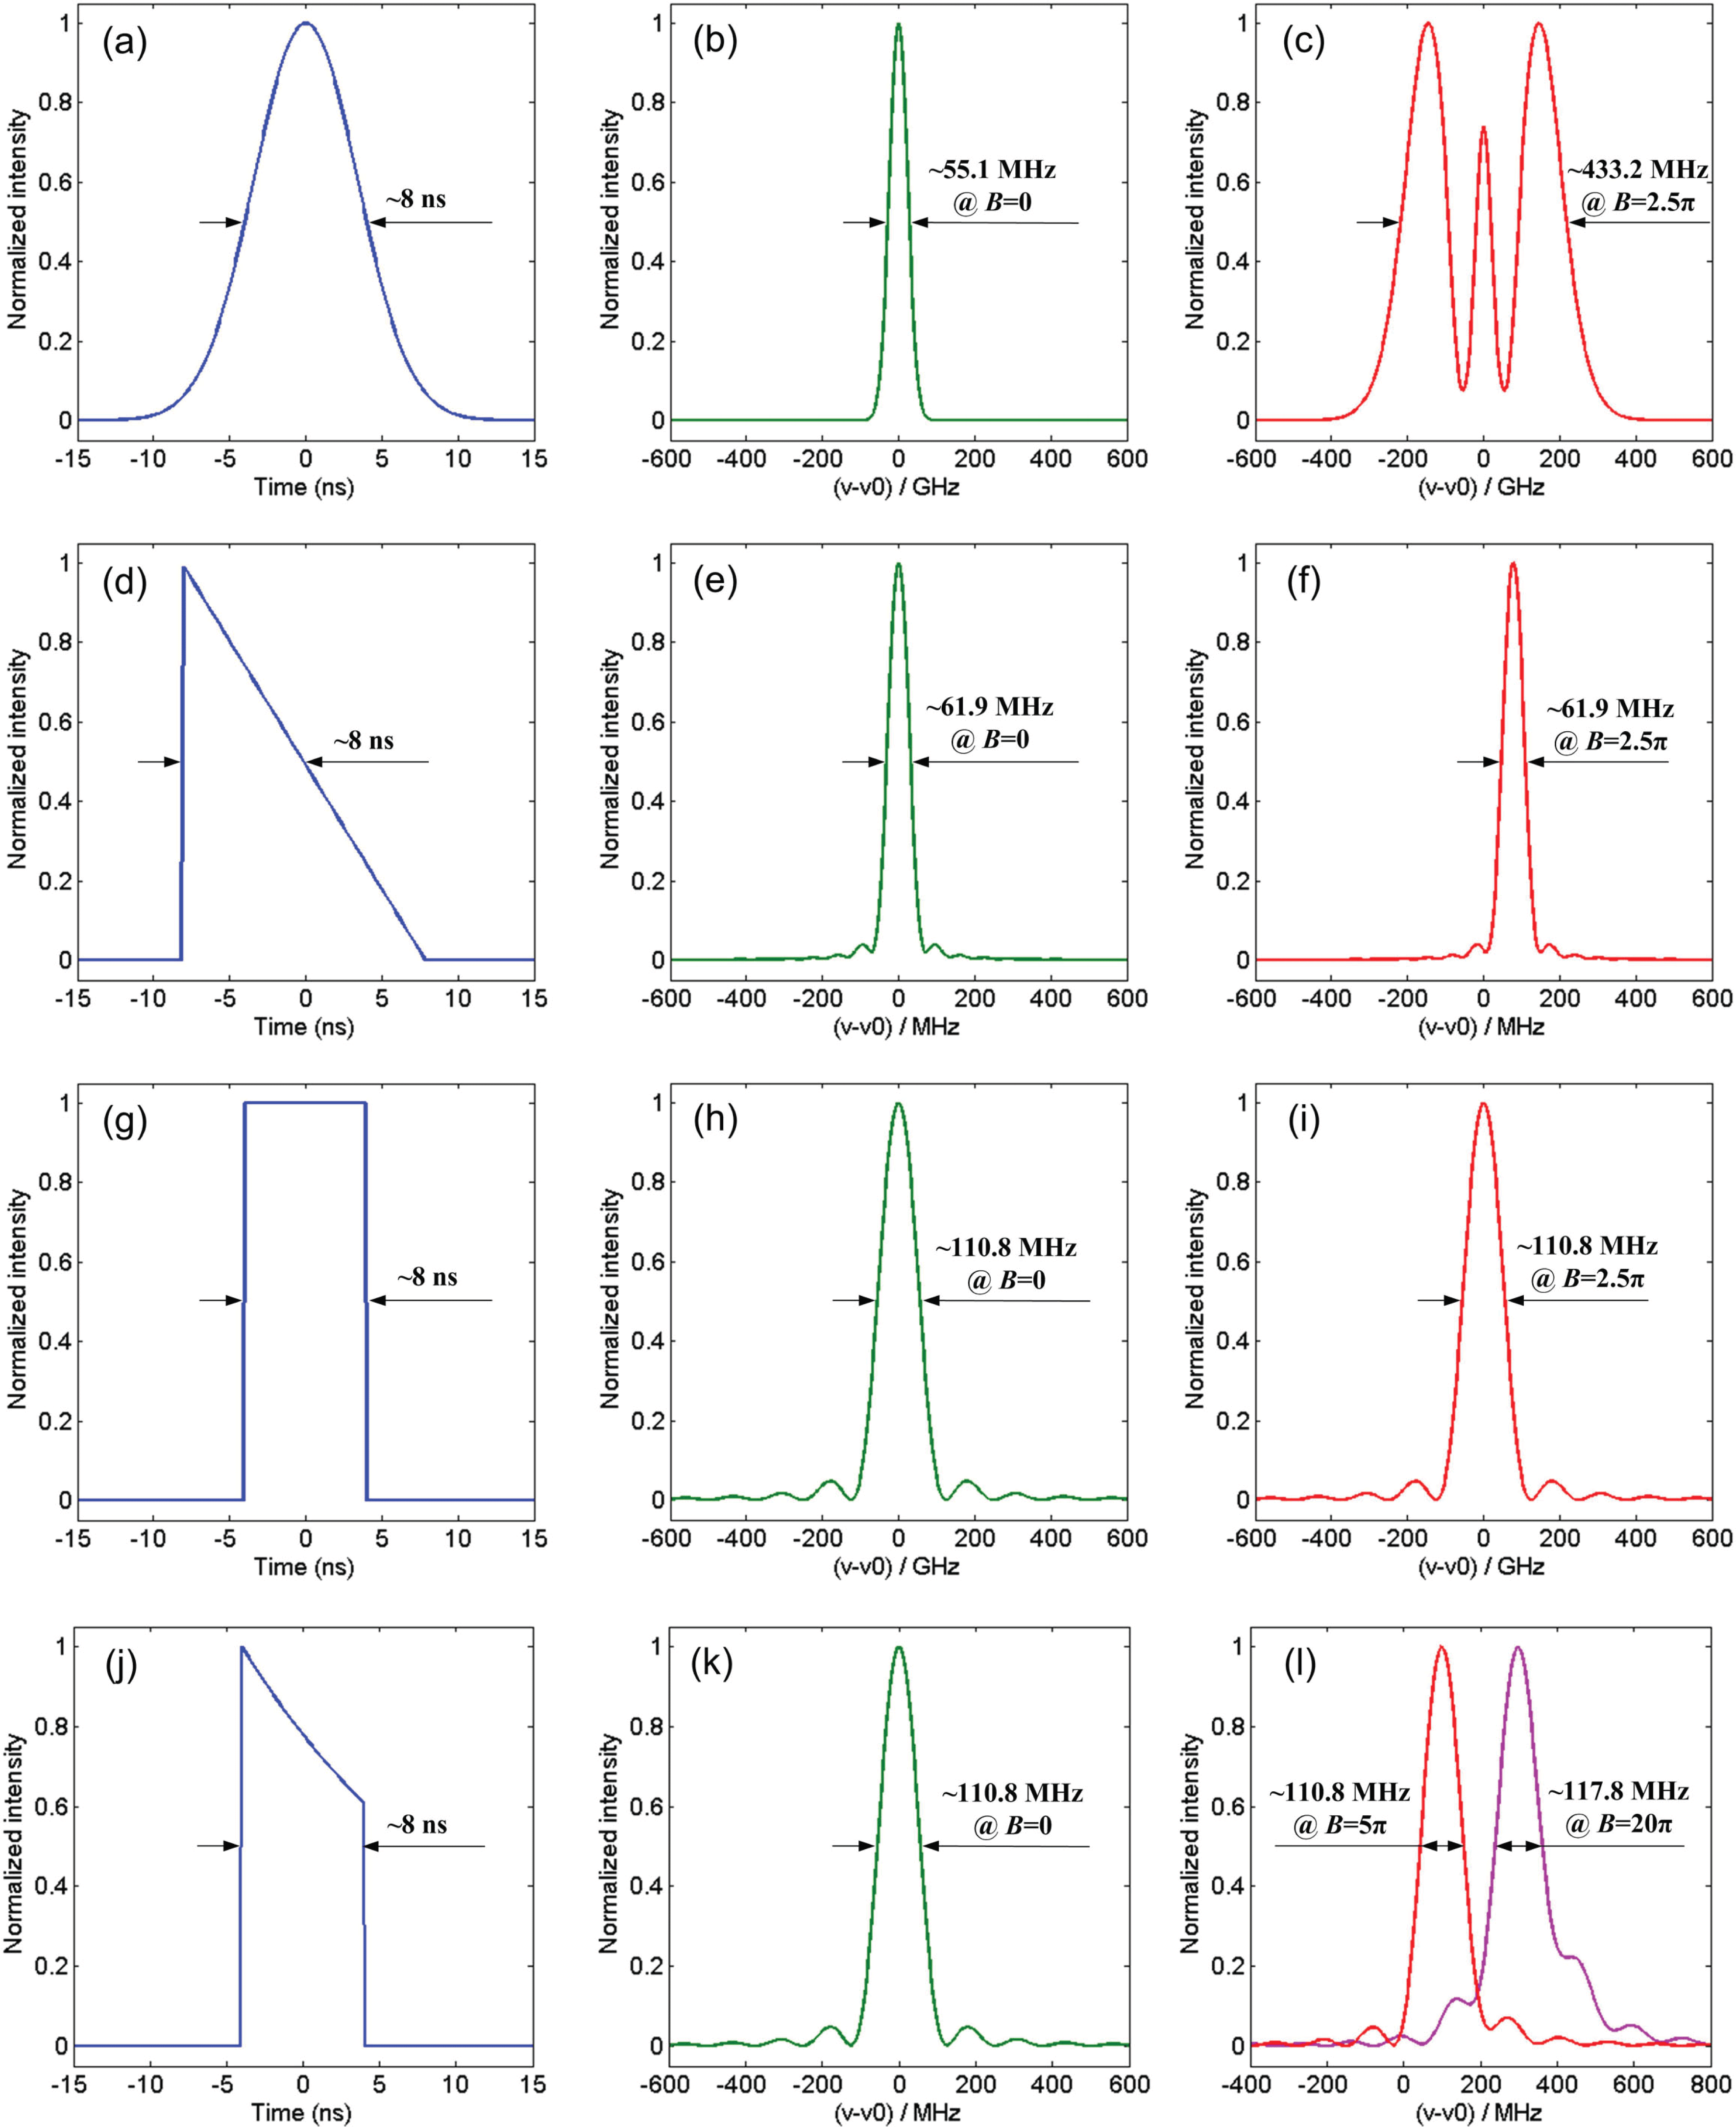
Figure 1. Calculated pulse shapes and the corresponding spectra. (a) Gaussian-shape pulse and the corresponding (b), (c) spectra; (d) sawtooth-shape pulse and the corresponding (e), (f) spectra; (g) square-shape pulse and the corresponding (h), (i) spectra; (j) distorted-square-shape pulse and the corresponding (k), (l) spectra.
In fiber amplifiers, the pulse shape is always distorted because of gain saturation[Reference Malinowski, Vu, Chen, Nilsson, Jeong, Alam, Lin and Richardson27, Reference Schimpf, Ruchert, Nodop, Limpert, Tünnermann and Salin28]. Here we suppose the intensity decreases as
![]() $\exp [-(t-t_{s})/2t_{p}]$
, where
$\exp [-(t-t_{s})/2t_{p}]$
, where
![]() $t_{s}$
is the time at the rising edge of the pulse, and
$t_{s}$
is the time at the rising edge of the pulse, and
![]() $t_{p}$
is the pulse width of the square-shape pulse. The pulse shape and corresponding spectrum are shown in Figures 1(j) and 1(k). Compared with Figure 1(h), we find that the spectrum changed only slightly and the linewidth remained at
$t_{p}$
is the pulse width of the square-shape pulse. The pulse shape and corresponding spectrum are shown in Figures 1(j) and 1(k). Compared with Figure 1(h), we find that the spectrum changed only slightly and the linewidth remained at
![]() ${\sim}110.8$
MHz. Because the value of
${\sim}110.8$
MHz. Because the value of
![]() $\unicode[STIX]{x2202}I(t)/t$
changes with
$\unicode[STIX]{x2202}I(t)/t$
changes with
![]() $t$
, the spectrum changed when
$t$
, the spectrum changed when
![]() $B\neq 0$
. However, the change was very small compared to that of the Gaussian-shape pulse. For example, when
$B\neq 0$
. However, the change was very small compared to that of the Gaussian-shape pulse. For example, when
![]() $B=5\unicode[STIX]{x03C0}$
, the spectrum and linewidth were maintained very well compared with those when
$B=5\unicode[STIX]{x03C0}$
, the spectrum and linewidth were maintained very well compared with those when
![]() $B=0$
, and the signal-to-noise ratio (SNR) of the spectrum decreased only from 13.2 dB to 12.6 dB (here the SNR is defined as the ratio between the main frequency and the maximum side frequency). When
$B=0$
, and the signal-to-noise ratio (SNR) of the spectrum decreased only from 13.2 dB to 12.6 dB (here the SNR is defined as the ratio between the main frequency and the maximum side frequency). When
![]() $B=20\unicode[STIX]{x03C0}$
, the linewidth increased only to
$B=20\unicode[STIX]{x03C0}$
, the linewidth increased only to
![]() ${\sim}117.8$
MHz, and the SNR decreased to 8.5 dB, as shown in Figure 1(l).
${\sim}117.8$
MHz, and the SNR decreased to 8.5 dB, as shown in Figure 1(l).
We built an experimental setup to test the SPM-induced spectrum change, as shown in Figure 2. The pulsed laser seed was produced by modulating a single-frequency continuous-wave (SF-CW) laser with a central wavelength of
![]() ${\sim}1064$
nm[Reference Xu, Yang, Zhang, Wei, Qian, Chen, Zhang, Shen, Peng and Qiu29]. Electro-optic intensity modulators (EOIMs) with a high bandwidth of
${\sim}1064$
nm[Reference Xu, Yang, Zhang, Wei, Qian, Chen, Zhang, Shen, Peng and Qiu29]. Electro-optic intensity modulators (EOIMs) with a high bandwidth of
![]() ${>}10$
GHz were used to modulate the CW laser. An arbitrary function generator (AFG) was used to drive the EOIM to generate Gaussian-like pulses, and a square-wave generator (SWG) was employed to generate square-like pulses. In our experiment, the repetition rate and pulse width were set to 2 MHz and 8 ns, respectively. In order to suppress the amplified spontaneous emission (ASE) and avoid gain-saturation-induced pulse distortion, four single-mode-fiber-based preamplifiers (SMF-PAs) were employed to boost the pulse seed from
${>}10$
GHz were used to modulate the CW laser. An arbitrary function generator (AFG) was used to drive the EOIM to generate Gaussian-like pulses, and a square-wave generator (SWG) was employed to generate square-like pulses. In our experiment, the repetition rate and pulse width were set to 2 MHz and 8 ns, respectively. In order to suppress the amplified spontaneous emission (ASE) and avoid gain-saturation-induced pulse distortion, four single-mode-fiber-based preamplifiers (SMF-PAs) were employed to boost the pulse seed from
![]() ${\sim}200~\unicode[STIX]{x03BC}\text{W}$
to
${\sim}200~\unicode[STIX]{x03BC}\text{W}$
to
![]() ${\sim}100$
mW. In each SMF-PA, a polarization-maintained Yb-doped fiber (PM YDF: with a core diameter of 6
${\sim}100$
mW. In each SMF-PA, a polarization-maintained Yb-doped fiber (PM YDF: with a core diameter of 6
![]() $\unicode[STIX]{x03BC}\text{m}$
) was core pumped by single-mode fiber-pigtailed 976 nm laser diodes (LDs) via wavelength division multiplexing (WDM). A band pass filter (BPF) followed by a YDF was used to filter the ASE and an isolator (ISO) was located at the end of the amplifier to prevent backward propagating power. Then the amplified pulses were launched into a single-mode non-PM passive fiber with a core diameter of 6
$\unicode[STIX]{x03BC}\text{m}$
) was core pumped by single-mode fiber-pigtailed 976 nm laser diodes (LDs) via wavelength division multiplexing (WDM). A band pass filter (BPF) followed by a YDF was used to filter the ASE and an isolator (ISO) was located at the end of the amplifier to prevent backward propagating power. Then the amplified pulses were launched into a single-mode non-PM passive fiber with a core diameter of 6
![]() $\unicode[STIX]{x03BC}\text{m}$
and a length of
$\unicode[STIX]{x03BC}\text{m}$
and a length of
![]() ${\sim}100$
m. Two
${\sim}100$
m. Two
![]() $99/1$
couplers were located before and after the passive fiber, and a fiber-pigtailed Fabry–Perot interferometer (FPI) with a spectral range of 4 GHz was employed to measure the spectra of the pulses from the 1% ports of the couplers.
$99/1$
couplers were located before and after the passive fiber, and a fiber-pigtailed Fabry–Perot interferometer (FPI) with a spectral range of 4 GHz was employed to measure the spectra of the pulses from the 1% ports of the couplers.

Figure 2. Experimental setup for spectral measurement of Gaussian-like and square-like pulses. EOIM, electro-optic intensity modulator; AFG, arbitrary function generator; SWG, square wave generator; SMF-PA, single-mode-fiber-based preamplifier; LD, laser diode; WDM, wavelength division multiplexer; PM YDF, polarization-maintained Yb-doped fiber; BPF, band pass filter; ISO: isolator; FPI, Fabry–Perot interferometer.
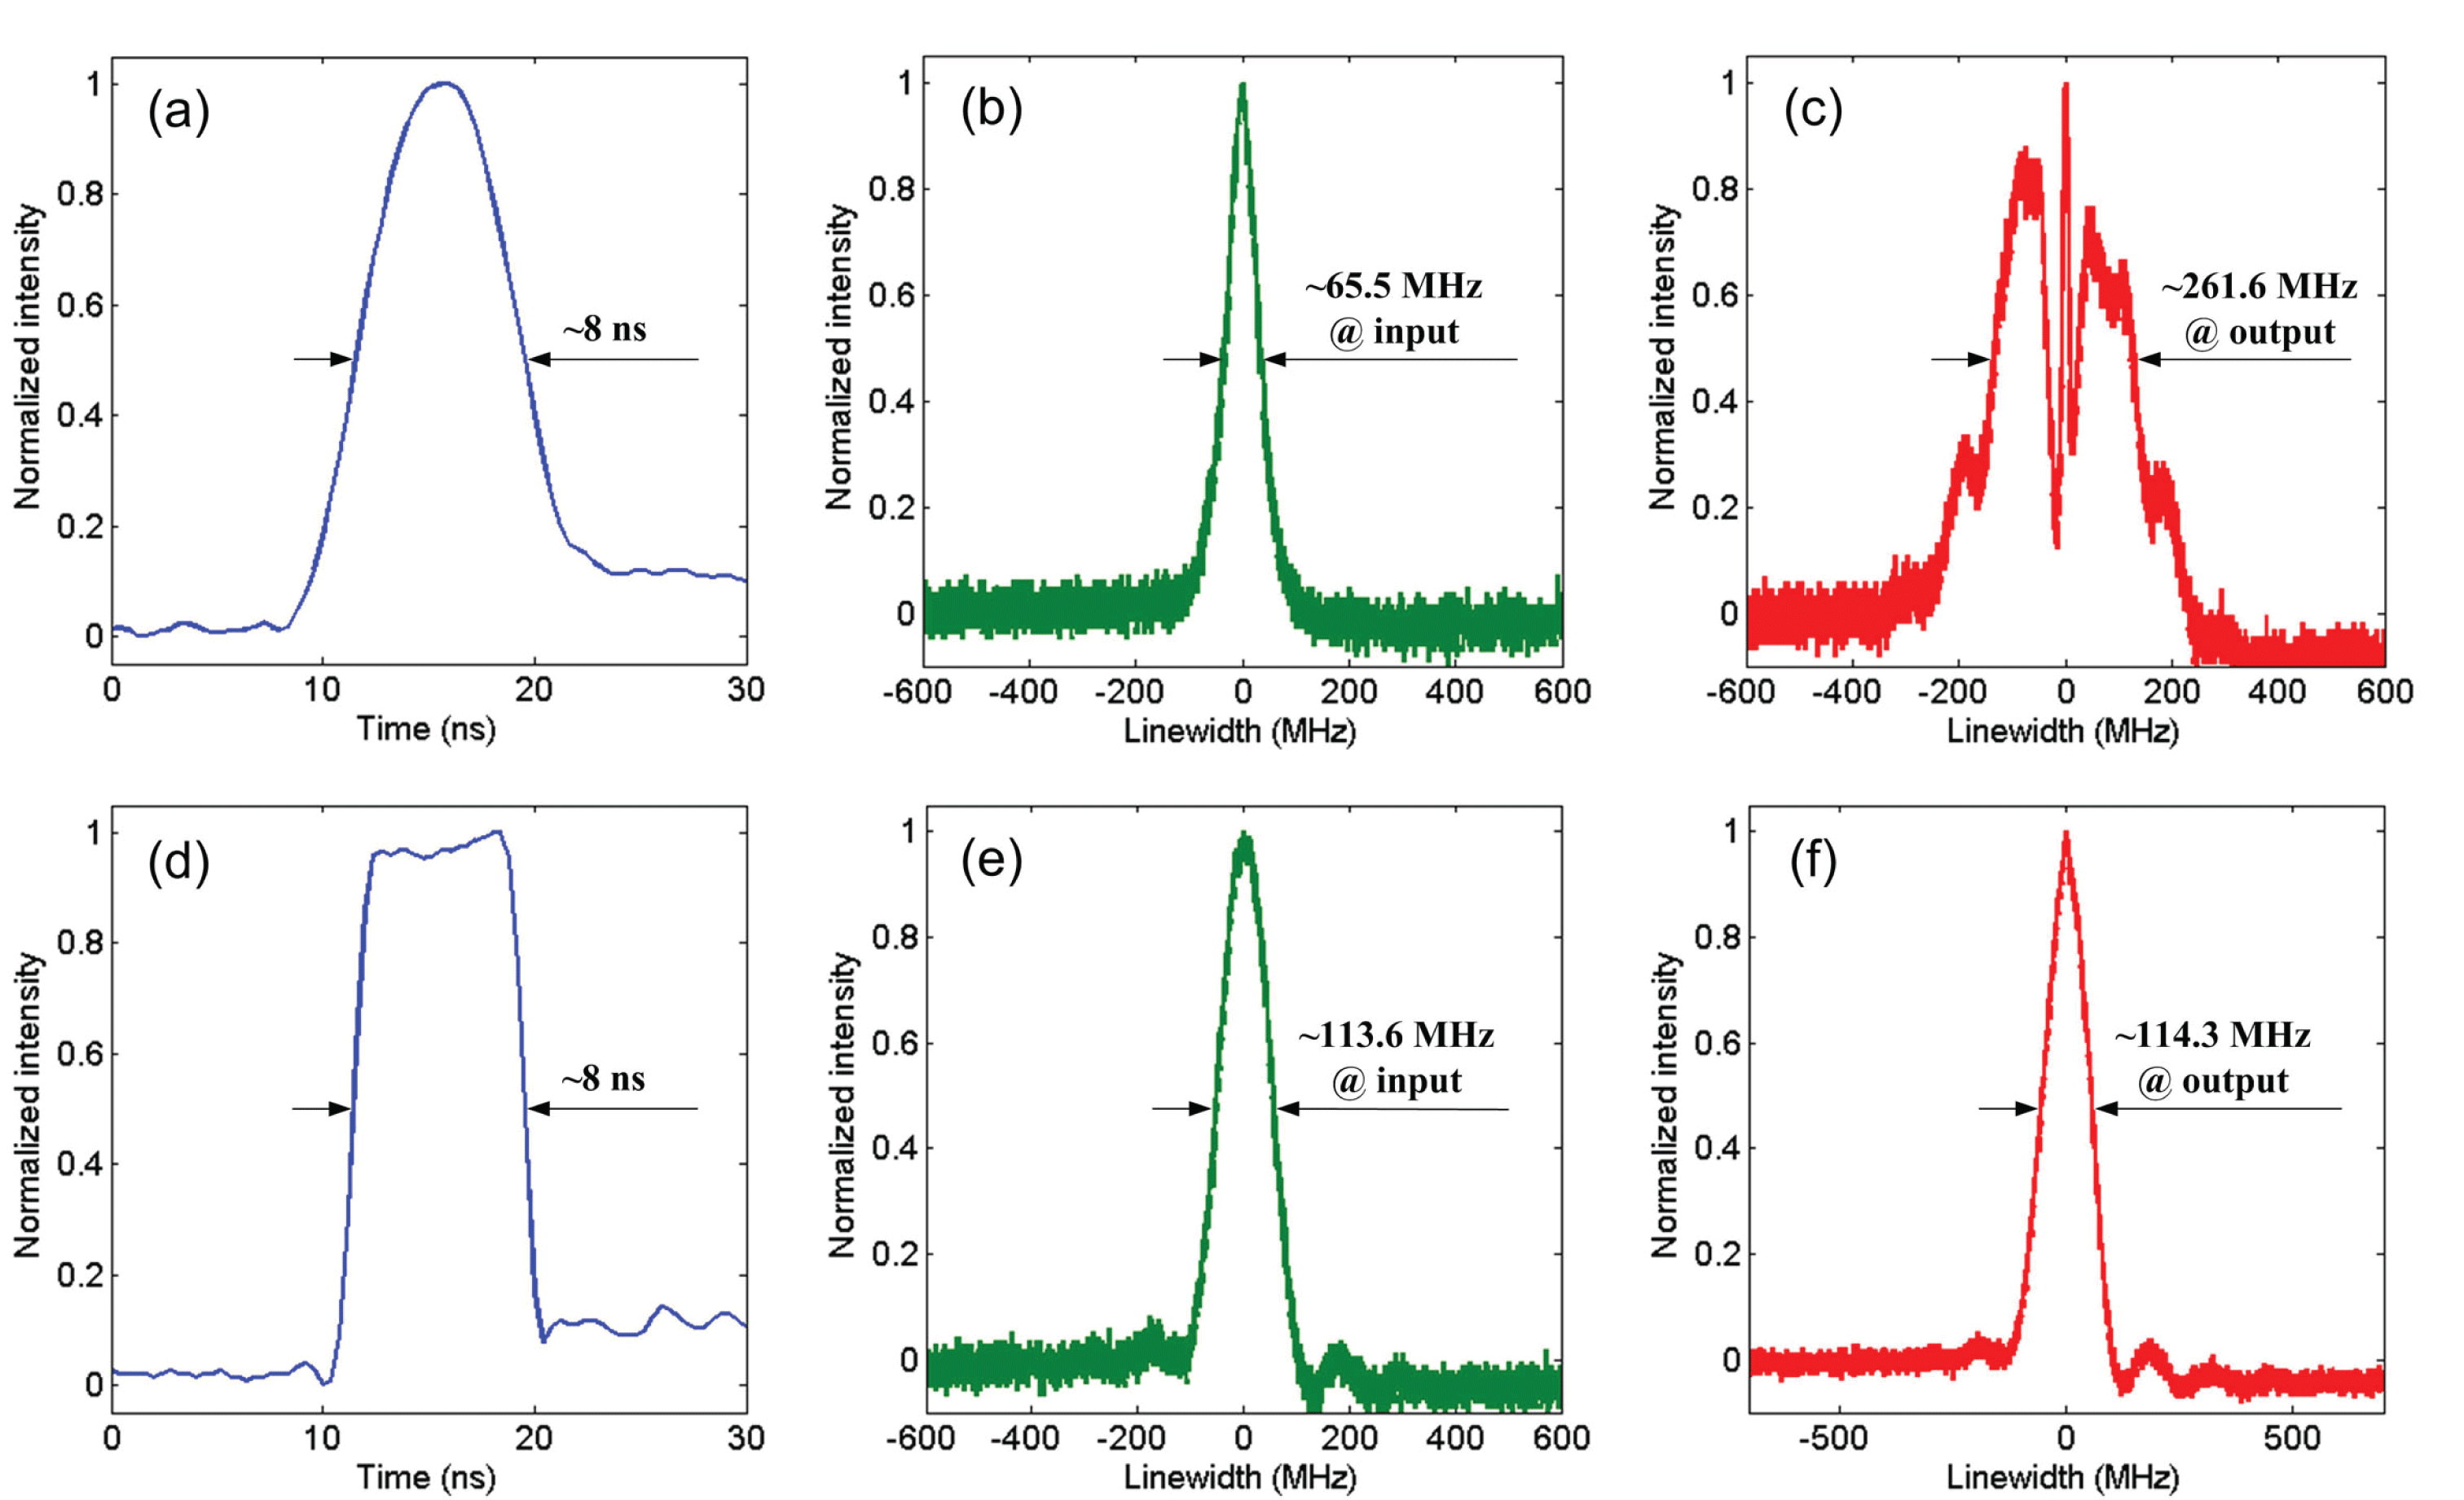
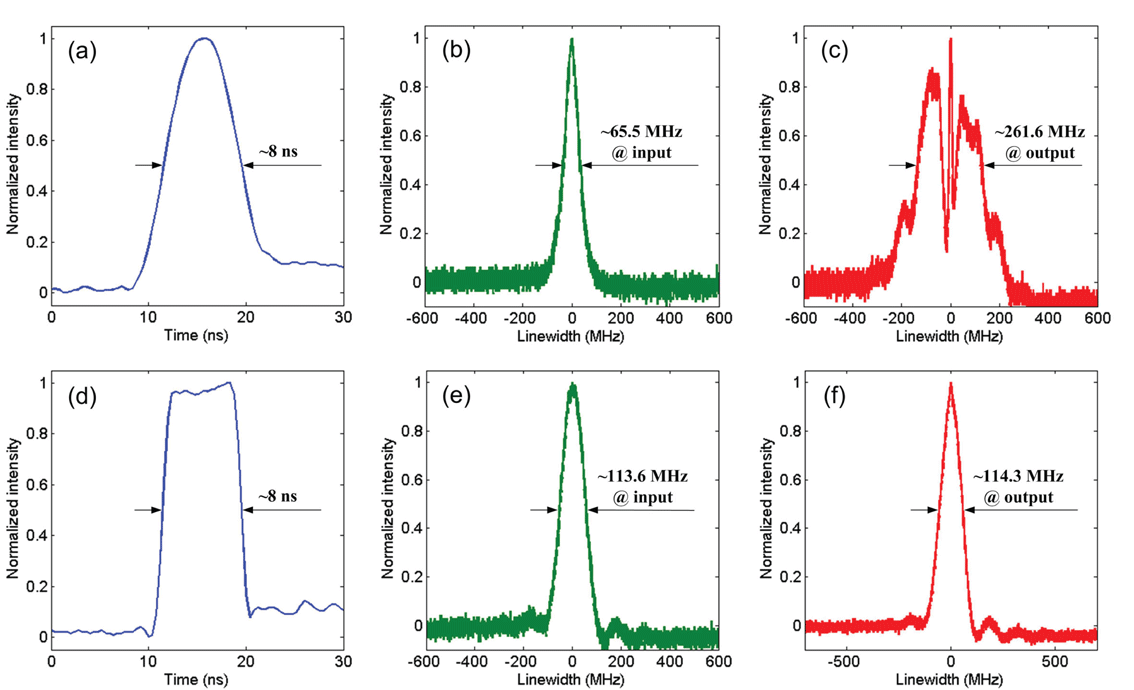
Figure 3. Measured pulse shapes and the corresponding spectra. (a) Gaussian-like pulse and corresponding spectra at the (b) input and (c) output of the GDF; (d) square-like pulse and corresponding spectra at the (e) input and (f) output of the GDF.
In our experiment, the Gaussian-like pulses and square-like pulses were fed into the system successively. The pulse shapes of the output laser are shown in Figures 3(a) and 3(d). The peak powers of the Gaussian-like and square-like pulses can be calculated approximately using the following formulas:
where
![]() $P_{\text{peak}}$
is the peak power,
$P_{\text{peak}}$
is the peak power,
![]() $P_{\text{ave}}$
is the average power,
$P_{\text{ave}}$
is the average power,
![]() $t_{\text{FWHM}}$
is the full-width at half-maximum, and
$t_{\text{FWHM}}$
is the full-width at half-maximum, and
![]() $f_{\text{RR}}$
is the pulse repetition rate. By using Equations (4) and (5), the peak power of the Gaussian-like and square-like pulses can be approximately estimated to be 5.9 W and 6.2 W, respectively. The spectra measured from coupler 1 and coupler 2 are shown in Figures 3(b), 3(e) and 3(c), 3(f). For the Gaussian-like pulse, the linewidth was broadened from
$f_{\text{RR}}$
is the pulse repetition rate. By using Equations (4) and (5), the peak power of the Gaussian-like and square-like pulses can be approximately estimated to be 5.9 W and 6.2 W, respectively. The spectra measured from coupler 1 and coupler 2 are shown in Figures 3(b), 3(e) and 3(c), 3(f). For the Gaussian-like pulse, the linewidth was broadened from
![]() ${\sim}65.5$
MHz to
${\sim}65.5$
MHz to
![]() ${\sim}261.6$
MHz because of the SPM in the passive fiber. The
${\sim}261.6$
MHz because of the SPM in the passive fiber. The
![]() $B$
-integral can be estimated to be
$B$
-integral can be estimated to be
![]() ${\sim}1.7\unicode[STIX]{x03C0}$
using the formula
${\sim}1.7\unicode[STIX]{x03C0}$
using the formula
![]() $B=\unicode[STIX]{x1D6FE}L_{\text{eff}}P_{\text{peak}}$
, where
$B=\unicode[STIX]{x1D6FE}L_{\text{eff}}P_{\text{peak}}$
, where
![]() $P_{\text{peak}}=5.9$
W,
$P_{\text{peak}}=5.9$
W,
![]() $L_{\text{eff}}=100$
m,
$L_{\text{eff}}=100$
m,
![]() $n_{2}=2.6\times 10^{-20}$
,
$n_{2}=2.6\times 10^{-20}$
,
![]() $\unicode[STIX]{x1D708}_{0}=3\times 10^{14}$
Hz, and
$\unicode[STIX]{x1D708}_{0}=3\times 10^{14}$
Hz, and
![]() $A_{\text{eff}}=\unicode[STIX]{x03C0}d^{2}\unicode[STIX]{x1D6E4}^{2}/4$
, where
$A_{\text{eff}}=\unicode[STIX]{x03C0}d^{2}\unicode[STIX]{x1D6E4}^{2}/4$
, where
![]() $d=6\times 10^{-6}$
m is the diameter of the passive fiber, and
$d=6\times 10^{-6}$
m is the diameter of the passive fiber, and
![]() $\unicode[STIX]{x1D6E4}=0.8$
is the ratio of the mode field radius relative to the core radius. However, the spectra of the square-like pulse remained almost unchanged after transmission in the passive fiber, as shown in Figures 3(e) and 3(f). These experimental results are in good agreement with the numerical simulation results.
$\unicode[STIX]{x1D6E4}=0.8$
is the ratio of the mode field radius relative to the core radius. However, the spectra of the square-like pulse remained almost unchanged after transmission in the passive fiber, as shown in Figures 3(e) and 3(f). These experimental results are in good agreement with the numerical simulation results.
3 High-peak-power square-like pulses with transform-limited linewidth
In order to test the linewidth control improvement in the high-power amplifier, we built a two-stage LMA fiber amplifier, as shown in Figure 4. In the first stage of the LMA fiber amplifier, a double-clad PM YDF with a core/cladding diameter of
![]() $10/125~\unicode[STIX]{x03BC}\text{m}$
was used as the gain fiber. A 976 nm laser diode (LD) was coupled into the YDF via a
$10/125~\unicode[STIX]{x03BC}\text{m}$
was used as the gain fiber. A 976 nm laser diode (LD) was coupled into the YDF via a
![]() $(2+1)\times 1$
signal/pump combiner, and the residual pump laser was stripped by a cladding laser stripper (CLS). In the main amplifier, a 976 nm laser diode was employed to pump the PM YDF with a core/cladding diameter of
$(2+1)\times 1$
signal/pump combiner, and the residual pump laser was stripped by a cladding laser stripper (CLS). In the main amplifier, a 976 nm laser diode was employed to pump the PM YDF with a core/cladding diameter of
![]() $30/250~\unicode[STIX]{x03BC}\text{m}$
via a
$30/250~\unicode[STIX]{x03BC}\text{m}$
via a
![]() $(6+1)\times 1$
signal/pump combiner. The cladding absorption of the PM YDF is
$(6+1)\times 1$
signal/pump combiner. The cladding absorption of the PM YDF is
![]() ${\sim}12~\text{dB}/\text{m}$
at 976 nm, so we used
${\sim}12~\text{dB}/\text{m}$
at 976 nm, so we used
![]() ${\sim}1.5$
m active fiber for absorption of the pump power. A collimator (CO) with
${\sim}1.5$
m active fiber for absorption of the pump power. A collimator (CO) with
![]() ${\sim}0.4$
m long PM passive fiber (GDF: with a core/inner-cladding diameter of
${\sim}0.4$
m long PM passive fiber (GDF: with a core/inner-cladding diameter of
![]() $30/250~\unicode[STIX]{x03BC}\text{m}$
) was fused to the end of the PM YDF for power delivery. A CLS was directly attached on the GDF for stripping the residual pump laser. A circulator was located before the main amplifier to monitor the backward propagating power in the main amplifier, which increases nonlinearly when SBS occurs.
$30/250~\unicode[STIX]{x03BC}\text{m}$
) was fused to the end of the PM YDF for power delivery. A CLS was directly attached on the GDF for stripping the residual pump laser. A circulator was located before the main amplifier to monitor the backward propagating power in the main amplifier, which increases nonlinearly when SBS occurs.

Figure 4. Experimental setup of the LMA fiber amplifier. LD, laser diode; FPI, Fabry–Perot interferometer; P1, P2, power meter; PM YDF, polarization-maintained Yb-doped fiber; CLS, cladding laser stripper; CO, collimator.
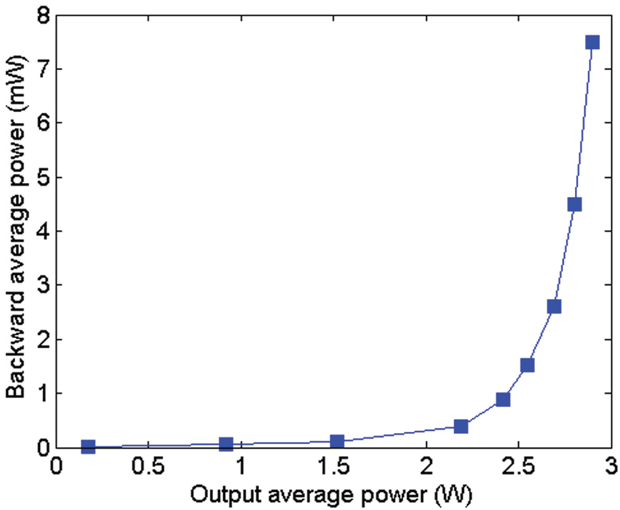
First, Gaussian-like pulses with a repetition rate of 80 kHz were generated and injected into the amplifier. In order to increase the extinction ratio, an acousto-optic modulator (AOM) was inserted after the EOIM (as shown in Figure 2(a)) to remove the leakage between the pulses. It is shown in Figure 5 that a nonlinear increase of the backward propagating power occurred on increasing the output power. This was attributed to the fact that the signal power dramatically transforms into Stokes light due to the SBS effect. The SBS threshold is always defined as the forward propagating pump power at which the backward propagating Stokes power increases rapidly, and is comparable to
![]() $\unicode[STIX]{x1D707}$
of the pump power[Reference Kobyakov, Sauer and Chowdhury15]. In high-power fiber amplifiers, SBS is undesirable, because the backward propagating Stokes light is potentially destructive. If
$\unicode[STIX]{x1D707}$
of the pump power[Reference Kobyakov, Sauer and Chowdhury15]. In high-power fiber amplifiers, SBS is undesirable, because the backward propagating Stokes light is potentially destructive. If
![]() $\unicode[STIX]{x1D707}$
is supposed to be 0.1%, the SBS average power threshold is
$\unicode[STIX]{x1D707}$
is supposed to be 0.1%, the SBS average power threshold is
![]() ${\sim}2.7$
W.
${\sim}2.7$
W.

Figure 5. Average backward propagating power of the Gaussian-like pulses as a function of the forward propagating output power.
The pulse shape and corresponding spectra are shown in Figure 6. Here a free-space coupling Fabry–Perot interferometer (FPI) with a spectral range of 1.5 GHz was employed to measure the spectra from the amplifier. We found that the linewidth was broadened from
![]() ${\sim}60.7$
MHz to
${\sim}60.7$
MHz to
![]() ${\sim}160.5$
MHz, and side frequencies could be clearly observed, indicating that the linewidth was markedly influenced by the SPM.
${\sim}160.5$
MHz, and side frequencies could be clearly observed, indicating that the linewidth was markedly influenced by the SPM.

Figure 6. Measured pulse shape and the corresponding spectra of the Gaussian-like pulse. (a) Output pulse shape; (b) spectrum of the pulsed seed; (c) spectrum of the output pulses.
Then, square-like pulses were employed as the signal laser. Here the repetition rate was also set to be 80 kHz, and the pulse width was set to be 5–8 ns. Figure 7 shows the backward propagating power as a function of the output power when the pulse widths were 8 ns, 7 ns, 6 ns and 5 ns. Here the peak power was calculated approximately using Equation (5). Based on the SBS threshold defined above, the SBS average/peak power thresholds are
![]() $2.27~\text{W}/3.55~\text{kW}$
,
$2.27~\text{W}/3.55~\text{kW}$
,
![]() $2.53~\text{W}/4.52~\text{kW}$
,
$2.53~\text{W}/4.52~\text{kW}$
,
![]() $2.84~\text{W}/5.92~\text{kW}$
and
$2.84~\text{W}/5.92~\text{kW}$
and
![]() $3.38~\text{W}/8.45~\text{kW}$
for the 8 ns, 7 ns, 6 ns and 5 ns pulses, respectively. It is clearly observed that the SBS threshold increases with decreasing pulse width. The reason is that the medium response in the SBS case is governed by the phonon lifetime of several nanoseconds[Reference Su, Zhou, Wang, Lü and Xu21, Reference Agrawal22]. When the pulse width is close to the phonon lifetime, it becomes more difficult to excite phonon waves for laser pulses with shorter pulse widths – hence, a higher SBS threshold can be obtained.
$3.38~\text{W}/8.45~\text{kW}$
for the 8 ns, 7 ns, 6 ns and 5 ns pulses, respectively. It is clearly observed that the SBS threshold increases with decreasing pulse width. The reason is that the medium response in the SBS case is governed by the phonon lifetime of several nanoseconds[Reference Su, Zhou, Wang, Lü and Xu21, Reference Agrawal22]. When the pulse width is close to the phonon lifetime, it becomes more difficult to excite phonon waves for laser pulses with shorter pulse widths – hence, a higher SBS threshold can be obtained.

Figure 7. Average backward propagating power of square-like pulses as functions of the (a) average forward propagating output and (b) peak power.
The pulse shapes and corresponding spectra of square-like pulses from the main amplifier are shown in Figure 8. When the pulse widths were 8 ns and 7 ns, the pulse shapes remained as a square-like pulse, as shown in Figures 8(a) and 8(d). However, for 6 ns and 5 ns pulses, the pulse shapes distorted noticeably due to the gain saturation, as shown in Figures 8(g) and 8(j). The maximum peak powers of the 8 ns, 7 ns, 6 ns and 5 ns pulses were 4.02 kW, 5.06 kW, 6.52 kW and 9.30 kW, respectively. The gain saturation increased with the increasing peak power, so pulse distortion was intensified with an increase in the peak power (that is, with a decrease in the pulse width). When the pulse width was 8 ns, the spectrum at the maximum output power of 2.57 W was very close to that at the minimum output power of 0.15 W (the pump power of the main amplifier was zero), as shown in Figures 8(b) and 8(c). However, with decreasing pulse width, the SPM-induced nonlinear phase shift and the gain-saturation-induced pulse distortion increased because of the higher output peak power. Therefore, the differences in the spectra of Figures 8(c), 8(f), 8(i) and 8(l) also increased. The SNRs were
![]() ${\sim}7.5$
dB, 7.3 dB, 6.7 dB and 6.1 dB, respectively. However, note that the linewidth was maintained very well during the power-scaling process, and the linewidths were still close to the transform-limited linewidths, which are 110.8 MHz, 126.6 MHz, 147.7 MHz and 177.3 MHz, respectively. The maximum output powers and corresponding linewidths are shown in Table 1.
${\sim}7.5$
dB, 7.3 dB, 6.7 dB and 6.1 dB, respectively. However, note that the linewidth was maintained very well during the power-scaling process, and the linewidths were still close to the transform-limited linewidths, which are 110.8 MHz, 126.6 MHz, 147.7 MHz and 177.3 MHz, respectively. The maximum output powers and corresponding linewidths are shown in Table 1.

Figure 8. Measured pulse shapes and the corresponding spectra of square-like pulses. (a) 8 ns pulse and (b), (c) corresponding spectra; (d) 7 ns pulse and (e), (f) corresponding spectra; (g) 6 ns pulse and (h), (i) corresponding spectra; (j) 5 ns pulse and (k), (l) corresponding spectra.
Table 1. Maximum output power and the corresponding linewidth in the main amplifier.

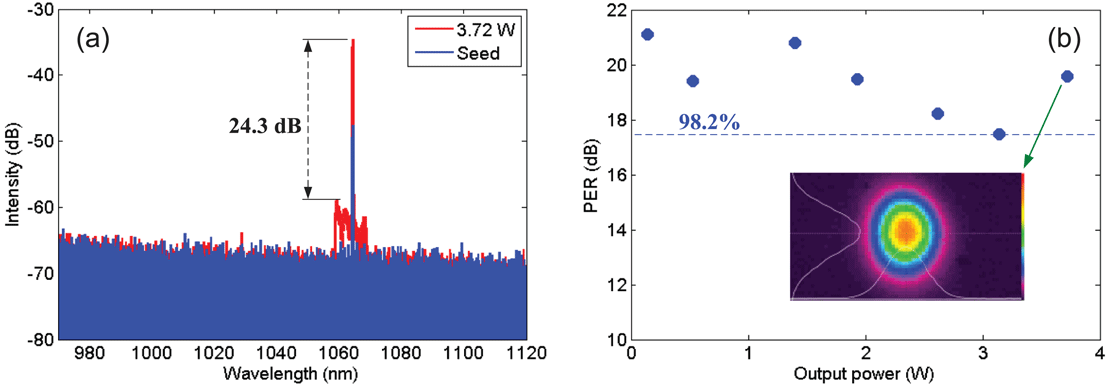
Figure 9(a) shows the spectra of the 5 ns pulses from the main amplifier when the pump powers were 0 W and 9.2 W. The optical-to-optical efficiency at the maximum output power was
![]() ${\sim}38\%$
. Thanks to the BPFs used in the SMF-PAs, the amplified spontaneous emission in the range 1030–1060 nm was effectively suppressed. The signal-to-noise ratio was more than 24 dB at the maximum output power. Figure 9(b) shows the polarization extinction ratio (PER) as a function of the output power for the 5 ns pulses. The PER is defined to be
${\sim}38\%$
. Thanks to the BPFs used in the SMF-PAs, the amplified spontaneous emission in the range 1030–1060 nm was effectively suppressed. The signal-to-noise ratio was more than 24 dB at the maximum output power. Figure 9(b) shows the polarization extinction ratio (PER) as a function of the output power for the 5 ns pulses. The PER is defined to be
![]() $10|\text{log}(P_{1}/P_{2})|$
, where
$10|\text{log}(P_{1}/P_{2})|$
, where
![]() $P_{1}$
and
$P_{1}$
and
![]() $P_{2}$
are the output s-polarized and p-polarized lasers from the PBS. In our experiment,
$P_{2}$
are the output s-polarized and p-polarized lasers from the PBS. In our experiment,
![]() $P_{1}$
and
$P_{1}$
and
![]() $P_{2}$
were measured by using an assembly of a half-wave plate (HWP) and a polarization beam splitter (PBS)[Reference Su, Yang, Xi, Zhou, Wang, Ma, Xu and Chen30]. As shown in Figure 9(b), the measured PER changed between 17.5 dB (98.2%) and 21.1 dB (99.2%), and the corresponding fluctuation was within 1%. At maximum output power, the PER of the pulsed laser was measured to be 19.6 dB (98.9%). The far-field intensity distributions were observed using a lens and an infrared CCD camera, which is inserted in Figure 9(b).
$P_{2}$
were measured by using an assembly of a half-wave plate (HWP) and a polarization beam splitter (PBS)[Reference Su, Yang, Xi, Zhou, Wang, Ma, Xu and Chen30]. As shown in Figure 9(b), the measured PER changed between 17.5 dB (98.2%) and 21.1 dB (99.2%), and the corresponding fluctuation was within 1%. At maximum output power, the PER of the pulsed laser was measured to be 19.6 dB (98.9%). The far-field intensity distributions were observed using a lens and an infrared CCD camera, which is inserted in Figure 9(b).

Figure 9. Measured (a) spectra and (b) PER in the main amplifier for 5 ns pulses.
4 Conclusions
In conclusion, we have proposed a novel concept to generate transform-limited laser pulses by temporally shaping the pulse seed. For square-shape laser pulses, the nonlinear phase shift is constant and
![]() $\unicode[STIX]{x1D6FF}\unicode[STIX]{x1D708}(t)=0$
, so a square-shape pulsed laser is theoretically immune to SPM-induced spectral broadening. The numerical results also show that even if the pulse shape distorts because of gain saturation, the spectrum can also be maintained much better compared with that of a Gaussian-shape pulse. We generated Gaussian-like pulses and square-like pulses by directly modulating a single-frequency CW laser. When the pulses, which had the same repetition rate, pulse width and average power, were coupled into a 100 m single-mode passive fiber, the linewidth of the Gaussian-like pulse was broadened from
$\unicode[STIX]{x1D6FF}\unicode[STIX]{x1D708}(t)=0$
, so a square-shape pulsed laser is theoretically immune to SPM-induced spectral broadening. The numerical results also show that even if the pulse shape distorts because of gain saturation, the spectrum can also be maintained much better compared with that of a Gaussian-shape pulse. We generated Gaussian-like pulses and square-like pulses by directly modulating a single-frequency CW laser. When the pulses, which had the same repetition rate, pulse width and average power, were coupled into a 100 m single-mode passive fiber, the linewidth of the Gaussian-like pulse was broadened from
![]() ${\sim}65.5$
MHz to
${\sim}65.5$
MHz to
![]() ${\sim}261.6$
MHz. However, the spectrum of the square-like pulse remained almost unchanged. Finally, we built a high-power square-shape pulsed all-fiber MOPA laser. In order to avoid gain-saturation-induced pulse distortion, six-stage amplifiers were employed to boost the peak power. In the main amplifier, a 1.5 m PM YDF with core/cladding diameter of
${\sim}261.6$
MHz. However, the spectrum of the square-like pulse remained almost unchanged. Finally, we built a high-power square-shape pulsed all-fiber MOPA laser. In order to avoid gain-saturation-induced pulse distortion, six-stage amplifiers were employed to boost the peak power. In the main amplifier, a 1.5 m PM YDF with core/cladding diameter of
![]() $30/250~\unicode[STIX]{x03BC}\text{m}$
was used as the gain medium. SBS-limited peak powers of 4.02 kW, 5.06 kW, 6.52 kW and 9.30 kW were obtained at pulse widths of 8 ns, 7 ns, 6 ns and 5 ns, respectively. The linewidths were maintained very well in the power-scaling process and were close to the transform-limited values. The measured PER of the nanosecond amplifier was better than 17.5 dB.
$30/250~\unicode[STIX]{x03BC}\text{m}$
was used as the gain medium. SBS-limited peak powers of 4.02 kW, 5.06 kW, 6.52 kW and 9.30 kW were obtained at pulse widths of 8 ns, 7 ns, 6 ns and 5 ns, respectively. The linewidths were maintained very well in the power-scaling process and were close to the transform-limited values. The measured PER of the nanosecond amplifier was better than 17.5 dB.
Acknowledgements
This research was supported by the National Natural Science Foundation of China (Nos. 61705265 and 61705264), the National Key R&D Programme of China (No. 2017YFF0104603) and the China Postdoctoral Science Foundation (No. 2017M620070).


