The reporting of body composition data in children requires the variability in body size during this rapid period of growth to be taken into consideration. Normalising body composition measurements for body size is one adjustment that is essential if results are to be meaningful in children. The importance of adjusting body components for height (HT) has been previously investigated in children, with fat mass (FM) and fat-free mass (FFM) being adjusted for HT(Reference Wells, Cole and the ALASPAC1). Studies have found that by raising HT to the power of 2 in both adults and children when adjusting FM and FFM the influence of body size can be minimised(Reference Wells, Cole and the ALASPAC1, Reference Van Itallie, Yang, Heymsfield, Funk and Boileau2). The adjustment for HT needs to be considered for expressions of all body compartments such as body cell mass (BCM), which is subtly different from FFM.
BCM is the metabolically active component of the FFM, which contains the energy-metabolising and work-performing tissue(Reference Moore3). The BCM is an ideal indicator of nutritional status, as it is the part of the body which is vital for function, with malnutrition being defined as a loss of functional cell mass. BCM estimation by total body K (TBK) counting can be used in health and disease, because the K concentrations in the BCM are extremely constant and kept within strict limits by homeostatic mechanisms(Reference Edmonds, Jasani and Smith4). Unlike measurements of FFM, measurements of BCM are a better reflection of nutritional status in children and those with clinical conditions because they are independent of FFM hydration changes that occur with growth and disease(Reference Murphy, Wells, Williams, Fewtrell, Davies and Webb5–Reference Haroun, Wells, Williams, Fuller, Fewtrell and Lawson7). For example, in children who are obese, there has been shown to be an increase in the hydration of the FFM, which would induce error in calculating FFM from many methods(Reference Haroun, Wells, Williams, Fuller, Fewtrell and Lawson7).
As with FM and FFM, it is important that BCM data are adjusted for body size. The amount of BCM is related to HT, with BCM increasing with growth in HT, regardless of improving nutritional status. Not only is it important to adjust BCM for HT when comparing nutritional status between individuals or populations of different heights, but a HT adjustment will also be essential when longitudinally monitoring children, who may grow in HT over the duration of nutritional intervention. It has been shown that as with FM and FFM, the BCM can be adjusted for size by dividing by HT2 in both normal-weight and malnourished women(Reference Wells, Murphy, Buntain, Greer, Cleghorn and Davies8). The ideal body size adjustment for BCM in children is yet to be established.
The purpose of the present study was therefore to examine the relationship between HT and BCM in healthy children, and to determine the power by which HT should be raised to adjust BCM for stature when examining nutritional status in children.
Material and methods
Subjects
The study sample was 146 healthy Caucasian children between the ages of 5 and 18 years who were controls in a study or recruited as part of a normative study. Subjects were recruited from schools, workplace newsletters and sporting groups. The study protocol was approved by the Royal Children's Hospital Ethics Committee. Written consent was obtained from all parents and the children over age 12 years, while verbal assent was obtained for children under age 12 years.
Measurements
All measurements were taken in the Body Composition Laboratory at the Royal Children's Hospital. Body weight was measured to the nearest 0·05 kg using calibrated digital scales (Tanita BWB-600; Wedderburn Scales, Brisbane, Qld, Australia) and HT was measured to the nearest 0·1 cm using a wall-mounted stadiometer (Holtain Instruments Ltd, Crymych, Dyfed, UK). BMI was calculated as weight divided by HT squared and BMI Z-scores were calculated using the LMS values published by the 2000 Centers for Disease Control and Prevention LMS values(9).
As 98 % of TBK is located in the BCM, BCM can be estimated from a known TBK. TBK analysis was performed using a shadow shield whole-body counter (Accuscan, Canberra Industries, Boston, MA, USA), which contains three sodium iodide crystal scintillation detectors arranged above a scanning bed. The crystals detect the 1·46 MeV γ rays emitted by the 40K in the body. A fixed proportion of the body's K occurs as the natural isotope 40K; thus TBK can be determined from the 40K scan.
The measurement of a subject's TBK required the subject to lie supine on a bed that is moved under the detectors. Two 1067 s scans were performed for each subject to check reproducibility. Background and sensitivity checks were considered in each measurement, with TBK reported in grams. BCM was calculated from TBK using the equation of Wang et al. (Reference Wang, St-Onge and Lecumberri10):
Statistical analysis
The relationship between BCM and HT was investigated using ln–ln regression analysis. For each sex, the ln of BCM (lnBCM) was regressed on the ln of HT (lnHT), and the gradient (p) of the regression equation was determined. The index BCM/HTp will then have zero correlation with HT, therefore representing a size-independent index of BCM.
A power will be more clinically useful if it is easy to apply, therefore we rounded p to the closest half decimal, ensuring that this value was within the standard error of p. To determine the implication of a correlation between BCM and HTp using this adjustment, the proportion of variation in BCM that could be attributed to HT was calculated. The statistical package Minitab (version 8.21; Minitab, Inc., State College, PA, USA) was used for statistical analysis.
Results
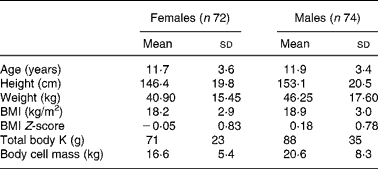
The final study sample consisted of 146 healthy children (seventy-two females and seventy-four males) between the ages of 5·2 and 17·9 years. The subject characteristics are given in Table 1. The male and female subjects were similar in ages and representative of a healthy paediatric population with BMI Z-scores close to zero.
Table 1 Characteristics of the study population
(Mean values and standard deviations)

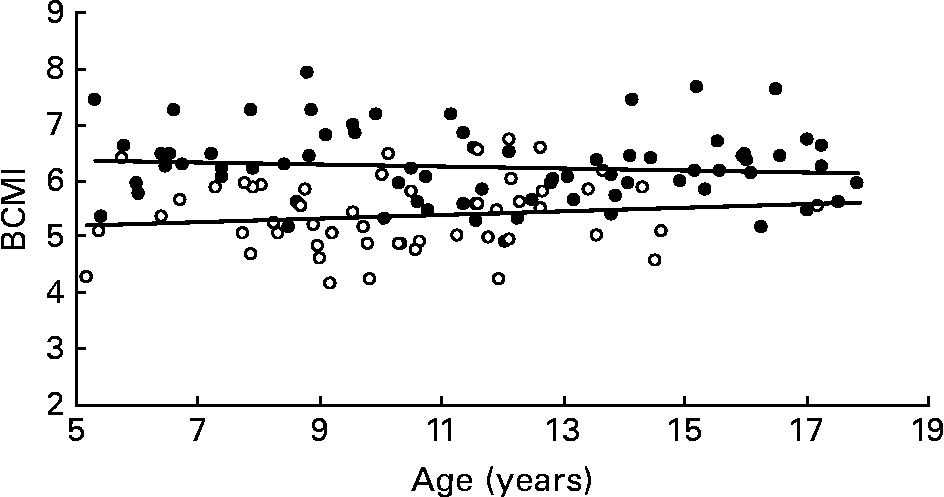
The statistics for the regression of lnBCM on lnHT are given in Table 2. The regression equation for females was lnBCM (kg) = 2·354 lnHT (m)+1·881 and for males was lnBCM (kg) = 2·927 lnHT (m)+1·724. The values of p were 2·35 (se 0·09) and 2·93 (se 0·10) for the female and male groups respectively. The closest half decimal to which these p values were rounded was 2·5 for females and 3·0 for males. If the BCM indices (BCMI) of BCM/HT2·5 for females and BCM/HT3·0 for males were applied, then the proportion of variation in these indices that could be attributed to HT was 2 % for females and 1 % for males. The BCMI was plotted against age for males and females in Fig. 1 to demonstrate that effect of stature on BCM was essentially eliminated using the BCMI. The regression equation was BCMI = 0·033age+5·0386 for males and BCMI = − 0·0176age+6·4554 for females.
Table 2 Regression of log of body cell mass on log of height

* Gradient of the regression equation.

Fig. 1 The body cell mass index (BCMI) of males (○) and females (●) plotted against age. For males, y = 0·033x+5·0386; for females, y = − 0·0176x+6·4554.
Discussion
The aim of the present study was to examine the relationship between BCM and HT in healthy children to determine the optimal adjustment of BCM for HT. The study shows that BCM can be adjusted in children using the BCMI of BCM/HT2·5 for females and BCM/HT3 for males. The regression equations for females and males both gave values for p close to 2·5 and 3, but not equal to this value. By using the numerically convenient and statistically valid HT adjustment of 2·5 for females and 3 for males, the amount of variation that is not accounted for by this adjustment is minimal, being less than 2 %. Thus there is no benefit to be gained from using the specific power values determined.
Our findings show that there is a difference between males and females in the relationship between BCM and HT. It is clear from the present study that the same power correction for HT can not be used in males and females and using the same BCMI would introduce significant variation not accounted for in HT of up to 40 %. Flynn et al. (Reference Flynn, Woodruff, Clark and Chase11) examined the regression of TBK on HT in 462 children. Their findings support the present result of a sex difference, showing that above 135 cm, about age 10 years, girls have less K per cm of HT than boys do. A sex difference is to be expected in the relationship between HT and BCM to account for the variation in composition of weight gain seen during childhood and adolescence.
No other studies, to the best of our knowledge, have examined the adjustment of BCM for HT in children. However, the relationship between BCM and size has been investigated recently in women of different weights. Wells et al. (Reference Wells, Murphy, Buntain, Greer, Cleghorn and Davies8) found that the power adjustment of two was suitable for use in healthy and malnourished women. The HT adjustment of 2 has also been used in previous studies of adults(Reference Talluri, Liedtke, Mohamed, Maiolo, Martinoli and De Lorenzo12, Reference Talluri13). From our findings it is evident that the power adjustment of 2 is not suitable for use in children. For both sexes the power of 2 falls beyond the 95 % CI, and if the power of 2 is applied, the proportion of variation not accounted for by HT increases to 21 % for females and 55 % for males.
Previous studies have used these sex-specific BCMI to represent nutritional status in children with cystic fibrosis and those undergoing bone marrow transplant(Reference White, Murphy, Hastings, Shergold, Young, Montgomery, Davies and Lockwood14, Reference Murphy, Buntain, Wainwright and Davies15). The use of these paediatric sex-specific BCMI will allow more accurate analysis of BCM data and expression of nutritional status between groups and individuals of children with different heights, especially those with clinical conditions and healthy controls. The clinical application of the present study's findings will also ensure that BCM will be able to monitor the longitudinal response of children to nutritional support, eliminating the effect of growth in stature.
The present study shows for the first time the normalisation for body size of BCM in children. By using the BCMI for healthy children of BCM/HT2·5 for females and BCM/HT3 for males, the effect of stature on BCM can be essentially eliminated. It is vital to adjust body compartment data for stature in children and thus this finding has significant clinical and academic significance for the reporting, monitoring and comparison of BCM data in children.
Acknowledgements
The authors wish to thank the Royal Children's Hospital Foundation for their financial support of the Children's Nutrition Research Centre. The authors have no personal, commercial, political, academic or financial conflicts of interest in this research. A. J. M. was responsible for the subject testing, research design and writing of the manuscript. P. S. W. D. conducted the statistical analysis and significantly contributed to the research design, interpretation of results and review of the manuscript.


