Introduction
Ice-core records can provide information not only on climatic and environmental changes on Earth, but also on events that have occurred elsewhere in the universe. 10Be is produced in the atmosphere by the interaction of high-energy cosmic-ray primaries and secondaries with nitrogen and oxygen, and usually adheres to aerosols, settling to the surface of the Earth mainly by means of wet deposition. The half-life of 10Be is about 1.5 x 10⁶ years. Solar activity has thus been detected from the records of 10Be in polar ice cores (Reference BeerBeer and others, 1988, Reference Beer1990, Reference Beer, Raisbeck, Yiou and Sonnett1991; Reference Raisbeck, Yiou, Stephenson and WolfendaleRaisbeck and Yiou, 1988; Reference Stuiver, Grootes and BraziunasStuiver and others, 1995). The discovery of 10Be peaks in Antarctic ice cores at about 35 kaBP (Reference Yiou, Raisbeck, Bourles, Lorius and BarkovYiou and others, 1985; Reference Raisbeck, Yiou, Bourles, Lorius, Jouzel and BarkovRaisbeck and others, 1987) has aroused special interest in the studies of environmental science, climatology and cosmology (Reference Sonett, Morfill and JokipiiSonett and others, 1987; Reference KocharovKocharov, 1990). Records of 10Be in the Byrd (West Antarctica) ice core and in the Camp Century (Greenland) ice core further aroused interest in the possibility of using 10Be as a time marker (Reference Beer, Bard and BroeckerBeer and others, 1992). If the 10Be peaks are caused by an increase in flux of cosmic rays into the Earth’s atmosphere, then simultaneous concentrations of other cosmogenic isotopes would also show peak values in various deposition media such as snow (thus records in ice cores) and deep-sea sediments in the middle and low latitudes. Here we report on cosmogenic 36C1 recorded in the Guliya ice core, Qinghai-Tibetan Plateau (QTP). 36C1 is produced in the atmosphere by the interaction of cosmic rays with argon. The half-life of 36C1 is about 3.0 xlO5 years.
Guliya Ice Gore
Information recorded in ice cores from the middle and low latitudes can establish a bridge for the interpretation of the mechanisms of climatic and environmental changes recorded in ice cores from bipolar regions. The QTP, located in the subtropical areas of the Northern Hemisphere, with a large amount of glaciers, provides an area for ice-core drilling. So far, many shallow and deep ice cores have been recovered in the plateau, such as Dunde ice cores from the Qilian mountains, Dongkemadi ice cores from the Tanggula mountains, Guliya ice cores from the west Kunlun mountains, Dasuopu ice cores from the Xixiabangma peak in the middle of the Himalaya, and Rongbuk ice cores from Mount Everest. Guliya ice cores are the longest of these.
The Guliya ice cap (35° 17’ N, 81 °29’ E) is the highest (summit 6710 m a.s.l), largest (about 376 km2) and thickest (average > 200 m) subtropical ice cap yet investigated. During 1990-92, a Chinese-American expedition carried out glaciological study and ice-core drilling during three visits to the ice cap. Ice temperatures measured at 10 m depth in the boreholes at 6200 and 6710 m a.s.l in 1991 were about -15.5° and -18.1 °C respectively. In this respect, the Guliya ice cap resembles a polar glacier (Reference Tandong, Keqin, Xinping, Zhihong and ThompsonYao and others, 1992). Annual accumulation rate varied from 140 to 260 mmw.e. in the elevation zone 60406710 m a.s.l. (Reference ThompsonThompson and others, 1995). Six shallow ice cores and two deep ice cores were recovered from the ice cap during the three field seasons. The longest core, 308.6 m long, was drilled at about 6200 m in 1992. The estimated age for the bottom ice of this core is about 760 ka, based on the 36C1 concentration data (Reference ThompsonThompson and others, 1997; Reference TandongYao and others, 1997). This is consistent with the age at which the CTP was first glacierized (Reference Li and YafengShi and others, 1995).
Concentration of 36C1 in the Guliya Ice Core
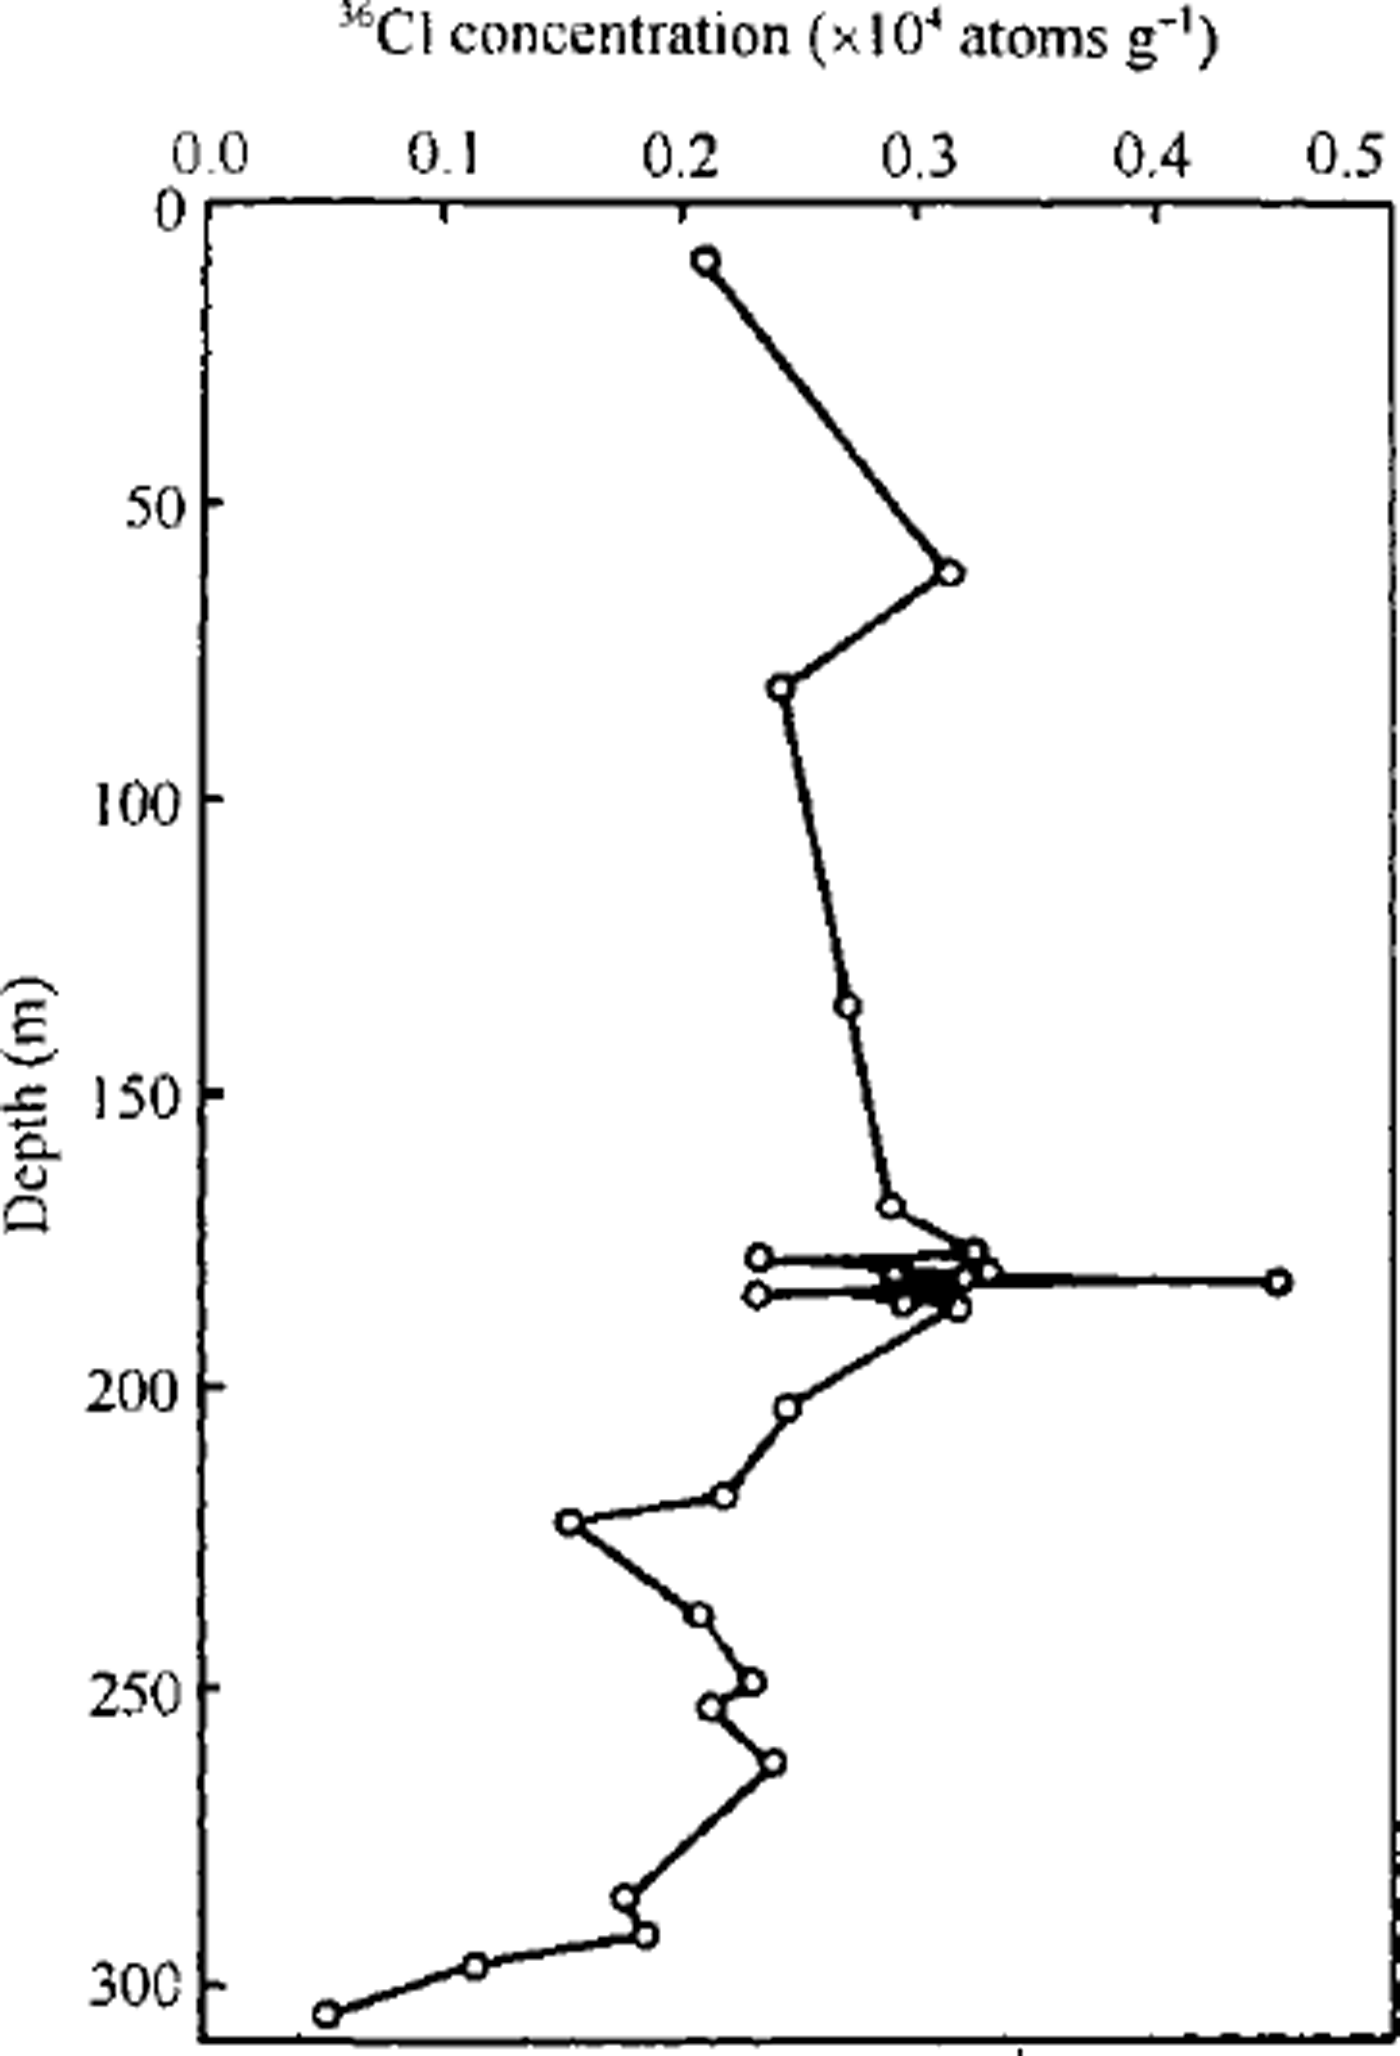
The basic purpose of measurements of 36C1 in the Guliya 308.6 m ice core was to date the lower part of the core (Reference ThompsonThompson and others, 1997; Reference TandongYao and others, 1997) since substantial thinning precludes counting annual layers below 120 m. However, in order to detect whether there is a 36C1 concentration peak in the Guliya ice core at about 35 ka BP, continuous sampling was carried out along a section of this core from 178 to 187m which represents ice deposited around 33-40 ka BE This dating estimate is according to a CH4- match time-scale (Reference ThompsonThompson and others, 1997) and a timescale developed by means of an ice-dynamics model and reference horizons (Reference TandongYao and others, 1997). The sampling interval along this core section was about 1 m, equivalent to about an 800 year period. Measurement of 36G1 in all 27 Guliya ice-core samples was done on an accelerator by J. Beer in Switzerland. An anomalously high (roughly twice the average concentration of all other samples from the upper 275 m section of the core (Fig. 1)) concentration of 36G1 was found in the ice sample from 183-184 m. According to the established time-scale, the peak value of 36G1 appears about 37-38 kaBP (Fig. 2)
For interpretation of the peak value, it is necessary to consider the climatic information. We can extract an accumulation record spanning only the past 2 ka from the Guliya ice cap (Reference TandongYao and others, 1996). Thus climatic conditions 37 kaBP may be derived only from the other paleoclimatic proxy indices, such as lake evolution and pollen records. Recently a pioneer study on pollen record in Dunde ice cores suggested that the vegetation in the QTP region is sensitive to abrupt, century-scale climatic changes (K.-B. Reference Liu, Yao and ThompsonLiu and others, 1998). Therefore, in a high-resolution lacustrine sediment core, century-scale climatic changes can be inspected. Studies of a lacustrine sediment core from lake Tianshuihai, west Kunlun mountains (near the Guliya ice cap), have found that climatic conditions were very humid around 37 kaBP (Liu Reference Guangxiu, Rui, Li, Li and ZhaoyuGuangxiu and others, 1998). These studies have used the ratio of Artemisia (typical of steppes) to ChenoPodiaceae (typical of deserts) as a humidity index in arid and semi-arid regions. It has also been found that lake levels in the west Kunlun mountains and in the north Tibetan Plateau were very high in the period 30-40kaBP (Reference LiLi and Shi, 1992; Reference LiLi, 1995). This supports the view derived from the pollen record of a high-precipitation regime, indicating that the peak 36C1 concentration around 37 ka BP can be attributed only to an increase in deposition rate of the cosmogenic isotope and not to a change in accumulation rate.
Comparison with the Records of Cosmogenic Isotopes in Polar Ice
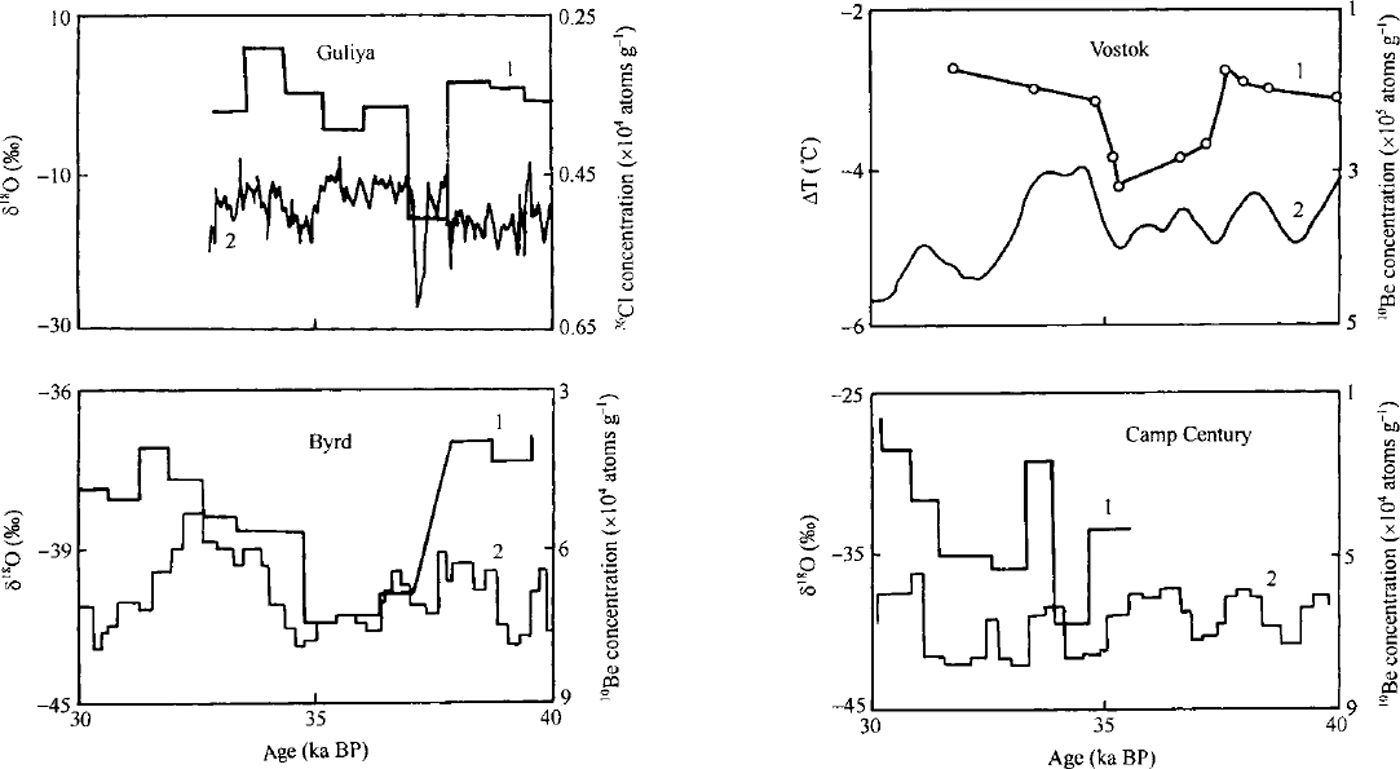
Changes in both atmospheric circulation pattern (including the intensity of air exchange between the troposphere and the stratosphere) and cosmogenic isotope production rate can result in apparent variations of cosmogenic isotope deposition rate at one site. If we assume a given global production rate of cosmogenic isotopes in the atmosphere, it seems improbable that the same trend would be found in concentration variations recorded in different sediment materials in different areas of the Earth. This is especially so when the trend lasts for longer time-scales ∼ 1 ka). Thus, by comparison of the records from different sites on the global scale, it is easy to ascertain whether meteorological effects should be eliminated as a factor influencing the cosmogenic isotope deposition rate. Figure 2 shows the record of cosmogenic isotopes in ice cores from the QTP, the Antarctic ice sheet and the Greenland ice sheet. It is emphasized that the 10Be peak at about 36 ka BP in the polar ice has not yet been interpreted in terms of accumulation changes (Reference Raisbeck, Yiou, Bourles, Lorius, Jouzel and BarkovRaisbeck and others, 1987, Reference Raisbeck, Yiou, Jouzel, Petit, Barkov, Bard, Bard and Broecker1992; Reference Beer, Bard and BroeckerBeer and others, 1992). Considering the time-scale uncertainty for each core, it is fair to surmise that the cosmogenic isotope peaks in Figure 2 occurred at about the same time. Recent studies on 36C1 and 10Be in the Greenland Ice Gore Project (GRIP) ice core have exhibited concentration spikes at about 37 kaBP (Reference BaumgartnerBaumgartner and others, 1997; Reference YiouYiou and others, 1997). In addition, peak 10Be concentrations in deep sea cores from the Gulf of California (Reference McHargue, Damon and DonahueMcHargue and others, 1995) and the Mediterranean Sea (Reference CastagnoliGastagnoli and others, 1995) have been found at about the same time. The above indicates that the increase in concentrations of cosmogenic isotopes at about 37 kaBP was a global event. This can be explained only by enhanced cosmogenic isotope production rate, and may be used as a time marker for dating of sediments.

Fig. 1. Variations with depth of 36CI concentration in the Guliya ice core.

Fig. 2. Comparisons of cosmogenic isotope concentration (curvel) with temperature (curve!) recorded mice cores from the QTPand bipolar regions. 10Be data in the Vostok (Antarctica) ice core are from Reference Raisbeck, Yiou, Bourles, Lorius, Jouzel and BarkovRaisbeck and others (1987). Temperature data are from Reference JouzelJouzel and others (1996). The time coordinate for the Vostok ice core is the Jouzel time-scale. 10Be and δ18O data in both the Byrd station (Antarctica) ice core and the Camp Century (Greenland) ice core are from Reference Beer, Bard and BroeckerBeer and others (1992).
From Figure 2, it can also be seen that the cosmogenic isotope event at about 37 ka BP coincided with a cold period (SK0 as a proxy of temperature) both in the bipolar ice cores and in the QTP ice core. Of these the temperature decrease on the QTP was the most remarkable among the records, which may indicate that the QTP is a region sensitive to global climate change. However, this cold event does not reach the magnitude of the Last Glacial Maximum in any of the ice cores studied. It is difficult to find moraine evidence for this cold event in these regions, but end-moraine debris formed about 34 ka BP was found in the Ecuadorian Andes, and the glaciers there extended to their furthest limits in that period during the Last Glacial Stage (Reference Clapperton and GardinerClapperton, 1987). It is evident therefore that the global cosmogenic isotope event coincided with a global cold event about 37 kaBP This phenomenon suggests the occurrences of these two events may have a common cause.
Discussion
Enhanced cosmogenic isotope is related directly to an increase in cosmic ray into the Earth’s atmosphere, which in turn is caused by an intensified cosmic-ray source (especially explosions of supernovae near the solar system), low solar activity and/or weak geomagnetic field.
Cosmic rays have been measured on the surface of the Earth for over half a century. It has been found that when cosmic ray incident to the surface increases greatly, especially when a nova explodes, the global air temperature may rise within 1 or 2 years (Reference ZhendongYu, 1990). On the other hand, comparison of the supernovae observed in 1572 and 1604 with the 10Be records in polar ice cores (Reference Beer, Raisbeck, Yiou and SonnettBeer and others, 1991) reveals no 10Be peak around these times. This may be because the two supernovae, Tycho and Kepler, were too far from the Earth. Moreover, there is no direct evidence for a supernova occurring near the solar system at about 37 kaBP. Thus it is premature to conclude that supernovae are related to the peak cosmogenic isotope or cold events at about 37 ka BP.
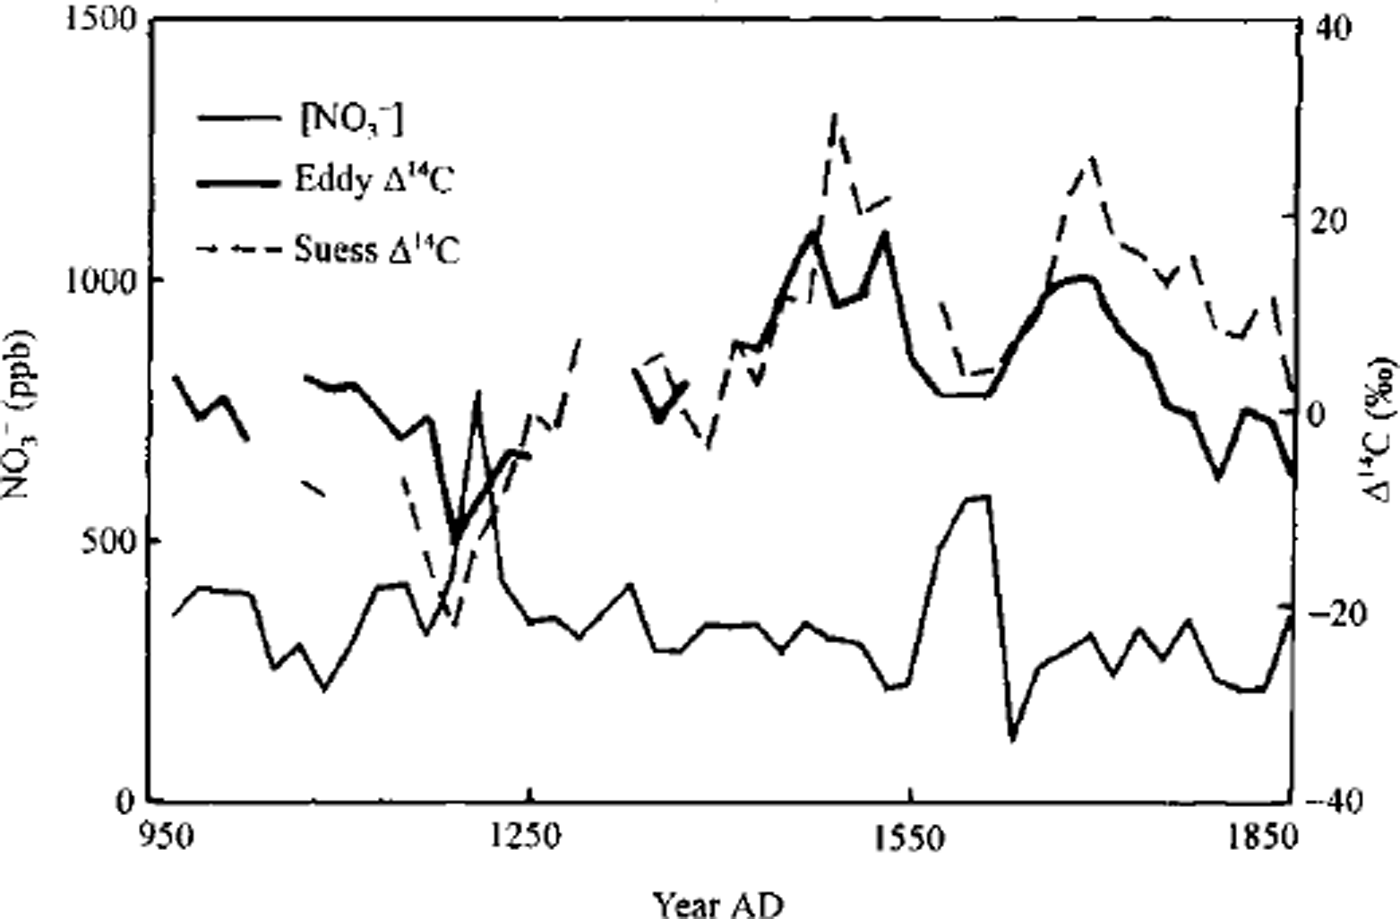
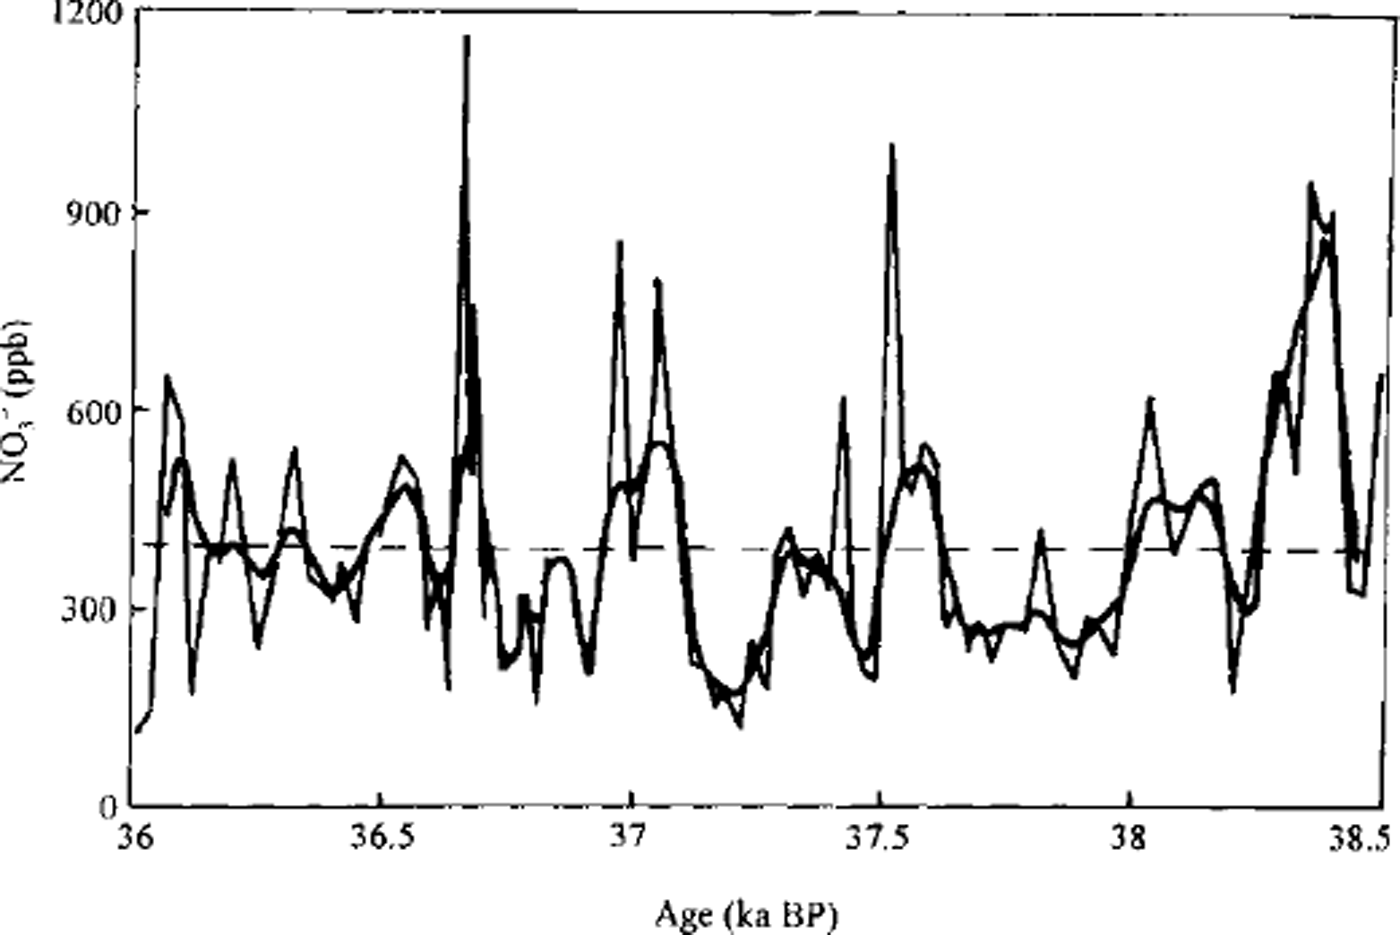
The well-known indicators of solar activity such as sunspots and ´14C in tree rings, are usually available only for the past few centuries or several thousand years. It is important to look for proxy indicators that can extend far enough into the past to detect solar activity at about 37 ka BP. We have investigated NO3- concentration in the Guliya ice core in the past 1000 years, and found that there are some significant periodicities in NO3- variations, e.g. 22.9, 88.1, 31.3, 5.5 and 10.3 years (periodicities listed from high to low spectral density), most of which coincide with periodicities of solar activity (Reference Ninglian, Tandong and ThompsonWang and others, 1998). Figure 3 shows the secular variations of W V in the Guliya ice core and ´14C in tree rings. A remarkable negative correlation can clearly be seen. Because human consumption of fossil fuel has rendered ^14C in tree rings unusable for indicating the intensity of solar activity since industrialization (Reference SuessSuess, 1965; Reference EddyEddy, 1977), only the data before industrialization are chosen here. This indicates that there is a positive correlation between the concentration of NO3- in the Guliya ice core and solar activity. Supposing this correlation also existed in the past, lower NO3 concentrations in 37-38 kaBP (Fig. 4) suggest that solar activity was low then. Also a decrease in solar radiation when solar activity was low (Reference Friis-Christensen and LassenFriis-Christensen and Lassen, 1991) may have led to a cold climate on Earth. Thus, low solar activity is a possible cause of the events at 37 kaBP.

Fig. 3. The secular variations of NO3– in the Guliya ice core and Δ14C in tree rings. All data are shown as 20 year means.

Fig. 4. Variations o/NO3 concentration (thin solid line) in the Guliya ice core around 37 ka BP. The thick solid line is the smooth curve through the concentrations. The dashed line is the average concentration.
Reference O’BrienO’Brien’s (1979) study pointed out that, for an almost zero dipole field, as may occur during a geomagnetic reversal, the mean global production rate of cosmogemc isotopes is enhanced by a factor of about 2. Moreover, it has been found that the climate warms when the geomagnetic field is strong, and cools when it is weak (Reference MaocangTang, 1996). Therefore investigation of the geomagnetic field condition is important for understanding the events at 37 ka BP. Reconstruction of paleointensity of the geomagnetic field in the past 80 ka from sea cores indicates that the intensity of the geomagnetic field reached a minimum at about 39 kaBP (Reference TrieTric and others, 1992) when the Laschamp geomagnetic reversal event occurred. Recently, a study of the 36C1 1 flux in the GRIP ice core has also shown that the peak at 37 kaBP is most likely the effect of the Laschamp event (Reference Baumgartner, Beer, Masarik, Wagner, Meynadier and SynalBaumgartner and others, 1998). Thus a weak geomagnetic field could also be responsible for the peak cosmogenic isotope and cold events at about that time.
Conclusions
The peak 36C1 concentration in the Guliya ice core at about 37 kaBP supports the previous view that the peak 10Be in polar ice at about that time can be used as a time marker (Reference Beer, Bard and BroeckerBeer and others, 1992). The peak cosmogenic isotope concentrations in ice cores from the QTP, the Antarctic ice sheet and the Greenland ice sheet suggest that global production rate was enhanced then. It is noted that this enhanced production rate event coincided with a global cold period. The causes of the phenomenon were possibly low solar activity and a weak geomagnetic field. Whether there was a supernova explosion, and if so its climatic effects, needs to be studied further.
Acknowledgements
We thank many scientists and graduate students from the Laboratory of Ice Gore and Gold Regions Environment, Lanzhou Institute of Glaciology and Geocryology, and the Byrd Polar Research Center. We especially thankj. Beer and his colleagues for analysis of ice-core samples. We are grateful to M. L. Duldig and an anonymous reviewer for their comments on the manuscript. This research was supported by the Chinese National and Chinese Academy of Science Qinghai-Tibetan Project (CN grant G1998040800 and GAS grants KZ951-06 and KZ951-A1-204-02), the National Science Foundation of China (NSF grants 49801004 and 49671021) and the U.S. National Science Foundation’s Office of Climate Dynamics and Division of Polar Programs (grants ATM-8519794, ATM-89116635 and DPP-9014931).


