Introduction
Ice-core research is widely conducted to reconstruct regional and global paleoclimates. Because the inland regions on polar ice sheets generally have low snow-accumulation rates, ice cores drilled from the inland region of polar ice sheets are particularly important for reconstruction of long-term paleoclimates up to several hundred thousand years ago (Reference WatanabeWatanabe and others, 2003a). The time-scale of several hundred thousand years includes several glacial periods. On the other hand, it is often difficult to determine short-term climatic fluctuations because annual layers are generally thin. Even if the information is preserved and highly compressed in some small amount of samples, analysis requires a sufficient volume, which limits the minimum period of time that can be recovered from the ice core. This limits the minimum time interval that can be resolved for high-time-resolution analysis. Furthermore, post-depositional processes in ice sheets, such as molecular diffusion in ice, can easily obscure the depth profiles of paleoclimate signals, such as the isotopes of H2O and chemical compositions, in places where snow accumulates slowly (e.g. Reference Barnes, Wolff, Mader, Udisti, Castellano and RöthlisbergerBarnes and others, 2003).
Researchers are often interested in annual or seasonal-scale variations in ice cores (e.g. Reference Legrand and MayewskiLegrand and Mayewski, 1997; Reference Curran, van Ommen and MorganCurran and others, 1998) for reconstruction of detailed climate and environment changes and for establishment of precise core dating. An ice core from the inland region in Greenland had seasonal variations in chemical composition during the Holocene (e.g. Reference SteffensenSteffensen, 1988; Reference Whitlow, Mayewski and DibbWhitlow and others, 1992) but not during the last glacial period. This is due to the thinning of annual layers with depth, long-term molecular diffusion in ice and lower accumulation rates during the glacial than during the Holocene. To detect seasonal variations during the last glacial period, we need to quantitatively determine how post-depositional processes such as molecular diffusion in ice affect the core properties. Then we will understand whether or not we can count annual layers of signals in the glacial period.
The Japanese Antarctic Research Expedition (JARE) conducted a deep ice coring at Dome Fuji (77˚19' S, 39˚40' E; 3810ma.s.l.) from 1995 to 1996. The project team recovered ice down to 2503 m, which contains climatic data back to 320 kyr (e.g. Reference Watanabe, Kamiyama, Motoyama, Fujii, Shoji and SatowWatanabe and others, 1999, Reference Watanabe2003a, Reference Watanabeb; Reference FujiiFujii and others, 2002). The present annual accumulation rate at Dome Fuji is about 30mmw.e. a–1 (Reference Kameda, Azuma, Furukawa, Ageta and TakahashiKameda and others, 1997), and the annual thickness of Dome Fuji ice core is estimated to be about 15–20mm for the Last Glacial Maximum (Reference WatanabeWatanabe and others, 2003b). Reference Watanabe, Jouzel, Johnsen, Parrenin, Shoji and YoshidaWatanabe and others (2003c) showed that some ion concentrations in the surface snow at Dome Fuji have seasonal fluctuations. For example, concentrations of Na+ and Cl– in surface snow increased in spring. The concentration of SO4 2– attained maximum value in spring and late autumn, then decreased in late summer and winter. Also, NO3 – had peak values in early summer and late winter, and Cl–/Na+ increased in summer.
Using radar echo sounding, Reference Fujita, Maeno, Furukawa and MatsuokaFujita and others (2002) found that the inner structure of the ice sheet below Dome Fuji station has horizontal layering with no stratigraphic disturbances. This observation leads us to assume that paleoclimate signals are preserved as horizontal layers with no stratigraphic disturbances in deep ice of the Dome Fuji region, even though the annual layer is thinner for the deep ice than it is at the surface. In this paper, we present high-resolution depth profiles of soluble ions from the last glacial period in the Dome Fuji ice core, discuss chemical reaction through post-deposition processes and search for possible seasonal variations.
Sampling Site and Analytical Procedure
As a pilot study, we selected a 523 mm long ice core from depths of 587.65–588.18 m. These depths contain ice that was deposited 25–26 kyr BP (Reference WatanabeWatanabe and others, 2003b). This section corresponds to the coldest period of the last glacial. A slab-shaped, 40 mm thick sample was cut from the ice core along the core axis. Then we sliced 3 mm off the outside of the ice core in a cold clean room using a pre-cleaned ceramic knife to decontaminate the surface. The cleaned ice core was sliced in the clean room with the ceramic knife every 2 mm of depth. Each sliced fraction was sealed in a Whirl-Pack in the clean room. In this way, we obtained 240 samples from the 500mm long core (the bottom 23 mm were used to attach the ice to the vise). The annual accumulation rate for the period corresponding to this sample is estimated to be 15–16mm (Reference WatanabeWatanabe and others, 2003b); thus, the 2 mm thick sampling allows us to detect seasonal variations.
After melting an ice sample in a Whirl-Pack, we analyzed the liquid for eight major soluble ions (Cl–, NO3 –, SO4 2–, F–, Na+, K+, Mg2+ and Ca2+) with an ion chromatograph (Dionex 500). The major soluble ions were analyzed after the sample was filtered with a pore size of 0.45 μm. The concentration of soluble ions was measured with an estimated error of <3%. As a reference, we analyzed ultrapure water through the same techniques and found no peaks on the chromatograph. This test indicates that our technique does not introduce detectable contamination.
Results
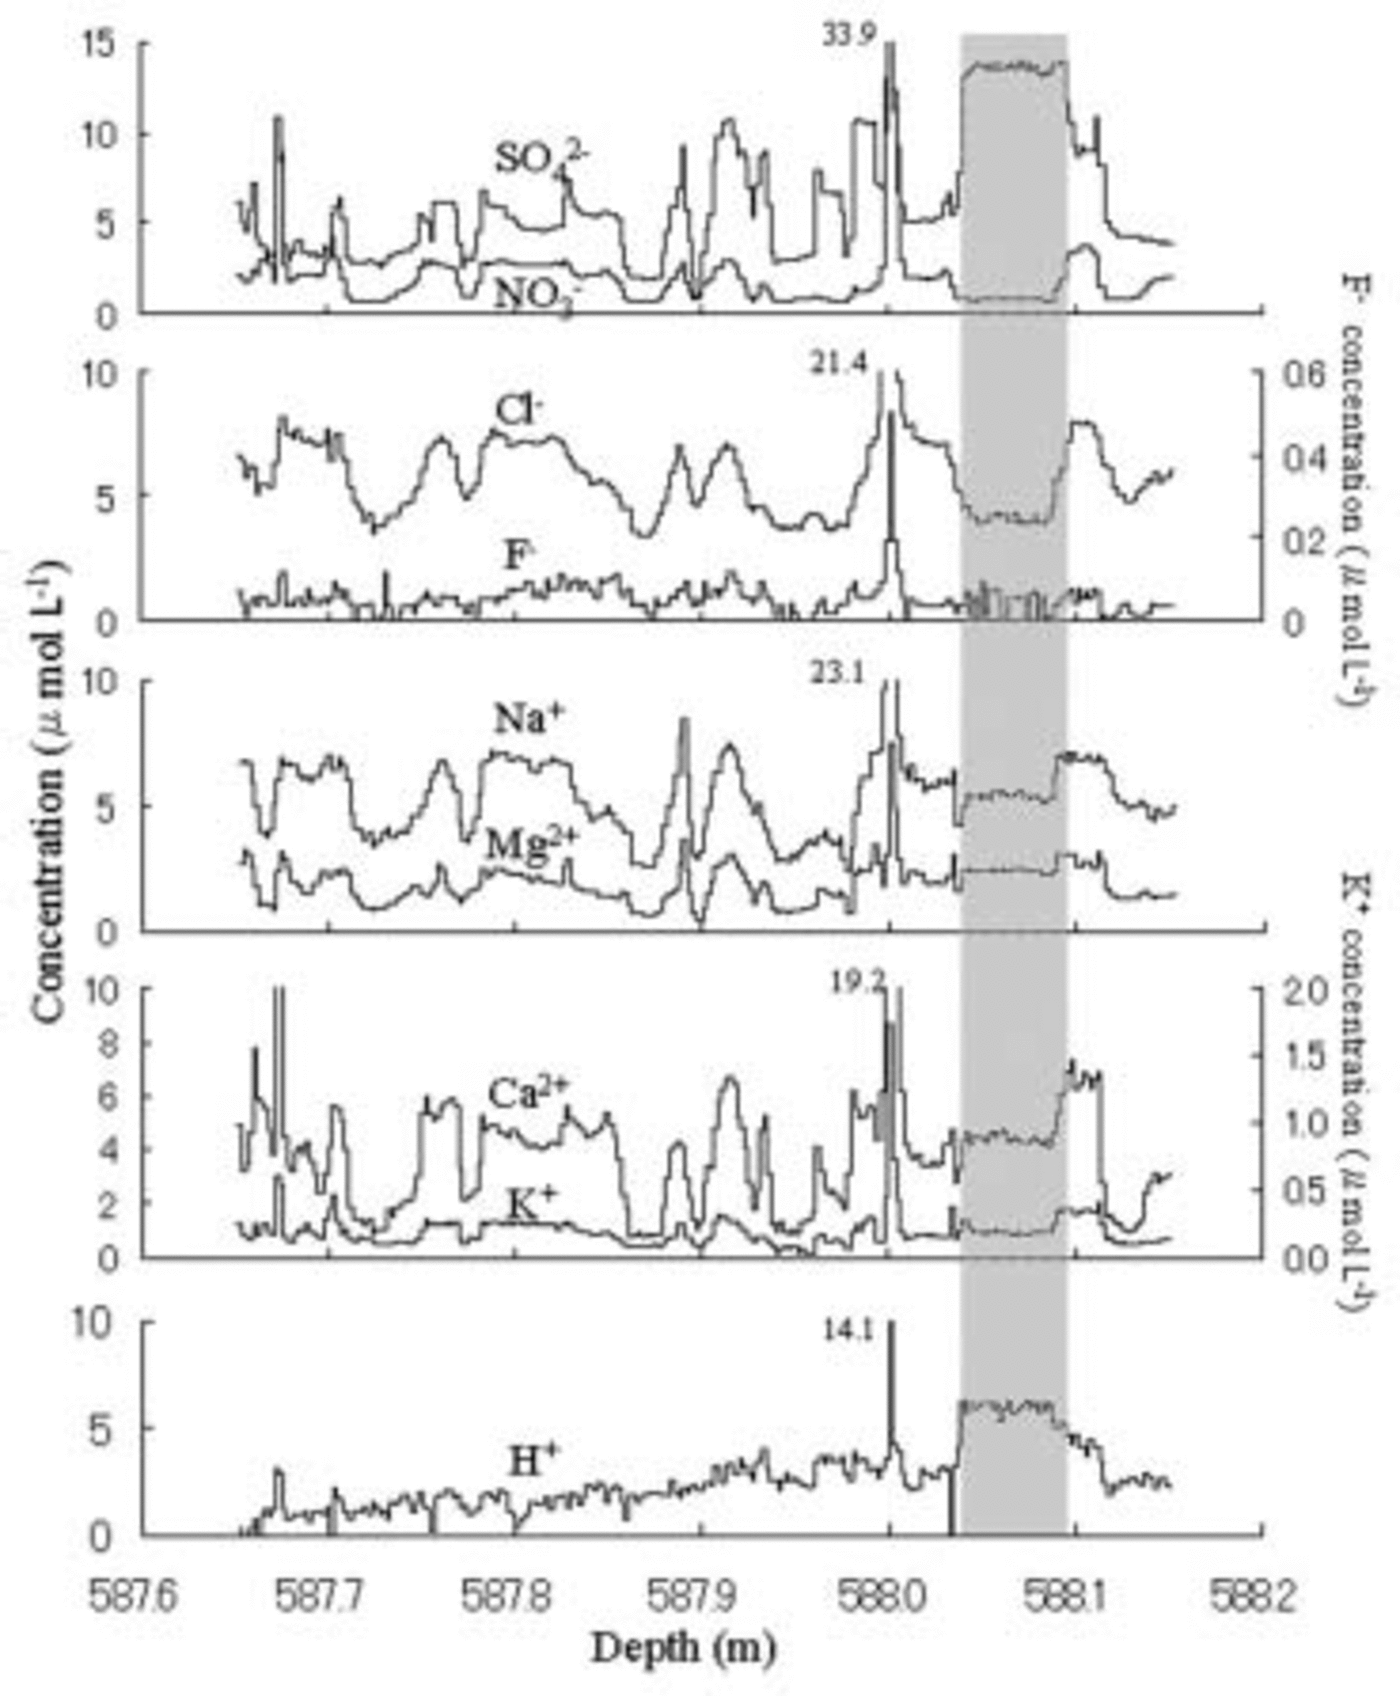
Figure 1 shows depth profiles of soluble ions from 587.65 to 588.18 m. The acidity, H+, is assumed to equal

Fig. 1. Vertical distributions of eight ion species from 587.65 to 588.18 m depth in the Dome Fuji ice core. Resolution is 2 mm. The gray shaded column shows the depth from 587.03 to 588.09m having non-synchronous fluctuations of cations and anions.
The primary anion is Cl– with an average concentration of 5.85 μmol L–1, the second is SO4 2– with 3.18 μmol L–1 and the third is NO3 – with 2.06 μmol L–1. The primary cation is Na+ with an average of 5.46 μmol L–1, the second is H+ with 2.64 μmol L–1 and the third is Ca2+ with 2.03 μmol L–1. All anions and cations show synchronous fluctuations except in the depth range 588.03–588.09m shown as gray column in Figure 1, where higher SO4 2– and H+ levels occurred simultaneously with depressed anions. This event may be due to fallout of volcanic H2SO4. The fluctuation periods range from several millimeters to several centimeters.
Discussion
Coexistence of specific anions and cations
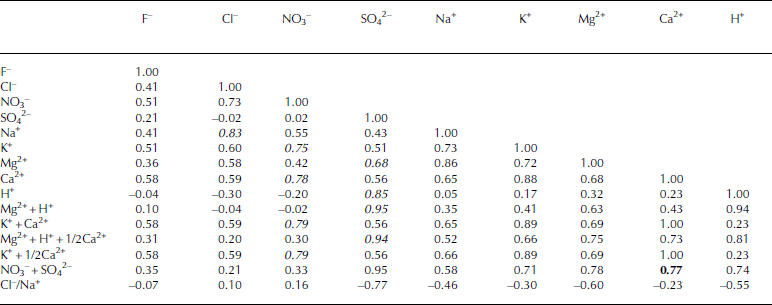
Table 1 shows correlation coefficients between ion pairs for the entire section of this sample. We did not use the ion concentrations near 588.00m in the statistical analyses because this depth has extremely high ion concentrations and the high concentrations would produce apparently high coefficients. We focus on anion and cation pairs having correlation coefficients exceeding 0.6. These include (1) Cl– with Na+ (r = 0.83) (2) NO3 – with K+ (0.75) and Ca2+ (0.78), and (3) SO4 2– with Mg2+ (0.68) and H+ (0.85).
Table 1 Correlation coefficient matrix for ion species and the sums of their equivalents for ice from 587.65 to 588.18 m in the Dome Fuji ice core. Italic values indicate correlation coefficients exceeding 0.6. The bold value shows the correlation coefficient between Ca2+ and NO3 –+SO42–

Figure 2 shows quantitative comparisons of anion and cation pairs with correlation coefficient higher than 0.6. The Cl– concentration roughly equals the Na+ concentration (Fig. 2a). The NO3 – concentration is lower than the sum of the K+ and Ca2+ concentrations but much higher than the K+ concentration (Fig. 2b). Therefore, Ca2+ contributes most of the cation excess. Assuming 1/2[Ca2+] and [K+] for the [NO3 –] pairs, we obtained good quantitative balance between this cation and anion pair. The SO4 2– concentration generally exceeds the sum of the Mg2+ and H+ concentrations (Fig. 2c). Assuming the cation deficit is due to the rest of [Ca2+], namely 1/2[Ca2+], a very high correlation coefficient and good quantitative balance are obtained between this anion and cation pair. As a result, we obtain the following equations:

Fig. 2. Comparisons of anions and cations that have correlation coefficients exceeding 0.6. Dotted lines show equivalence between the anion and cation.

The Ca2+ concentration correlates well with NO3 – + SO4 2– (r = 0.77). This indicates that Ca2+ coexists with both NO3 – and SO4 2–, which supports the above-mentioned assumptions. We show the proposed cation pairs for NO3 – and SO4 2– in Figure 2b and c, respectively.
Reference RöthlisbergerRöthlisberger and others (2003) showed that Na+ and Cl– in the Dome C ice core coexisted as a sea salt during the last glacial period. The present study suggests that this also holds for Na+ and Cl– in the Dome Fuji ice core. Reference Legrand, Wolff and WagenbachLegrand and others (1999) and Reference RöthlisbergerRöthlisberger and others (2002) found a high correlation between NO3 – and Ca2+ in Vostok and Dome C ice cores respectively during the last glacial period. The cause was thought to be the reaction of NO3 – with dust under the low temperatures that will reduce the NO3 – volatilization in snow. Our results show that the Dome Fuji ice core also has a high correlation between NO3 – and Ca2+ for the ice from the last glacial period.
Except for the possibility that some SO4 2– came from H2SO4, the SO4 2– in this ice-core sample probably exists as CaSO4 and MgSO4. Sources of SO4 2– and Ca2+ (Mg2+) are probably different; the major amount of SO4 2– originated from the production of marine bioorganic (Reference Ayers, Ivey and GilletAyers and others, 1991) and/or from the stratosphere, whereas Ca2+ and Mg2+ came from dust and/or sea salt (Reference Legrand and MayewskiLegrand and Mayewski, 1997). Reference Cragin, Hewitt and ColbeckCragin and others (1993) showed that a non-volatile acid such as SO4 2– is likely to remain in the snow even when the snow evaporates. This SO4 2– behavior suggests that the coexistences such as MgSO4 and CaSO4 are not due to the reaction of dust in the snow with volatile anions such as the coexistence of Ca(NO3)2.
Reference Barnes, Wolff, Mader, Udisti, Castellano and RöthlisbergerBarnes and others (2003) estimated the diffusion coefficients of Cl– and SO4 2– in a Dome C ice core to be about 10–14 and 10–16μ2 s–1, respectively, but the diffusion of Na+ was not detected. The diffusion coefficients of Cl– and SO4 2– are large enough to smooth out peaks separated by less than about 1 cm over the time period of 25–26 kyr. However, the Cl– and SO4 2– profiles in the Dome Fuji ice core have millimeter to centimeter peak separations. Reference Livingston and GeorgeLivingston and George (2002) suggested that the diffusion of H2O and/or ion species in an ice is restrained when an ion pair of anion and cation forms, a process they call anion–cation trapping. Because the entire section of the ice-core sample actually has several anion and cation pairs (Table 1), and anion– cation trapping probably occurred, the ion fluctuations still remain on millimeter to centimeter scales. Recent SEM analysis detected NaCl and MgSO4 in triple junctions in polar ice cores (Reference Barnes, Mulvaney, Robinson and WolffBarnes and others, 2002; Reference Cullen and BakerCullen and Baker, 2002). Our results show that the Dome Fuji ice core has similar coexistences, and that specific coexistences of the above species help to clarify the general characteristics of ion behavior.
Seasonal fluctuations of the depth profiles of ions species
The concentrations of Na+, Cl–, SO4 2– and NO3 – in surface snow at Dome Fuji show seasonal variations (Reference Watanabe, Jouzel, Johnsen, Parrenin, Shoji and YoshidaWatanabe and others, 2003c). Both SO4 2– and Na+ in surface snow have maxima in spring, and SO4 2– also has maxima in autumn. Near 588m depth, seasonal variations of Cl– and NO3 – probably disappeared due to their volatilization in snow. Furthermore, the depth range 588.03–588.09 m shown as gray column in Figures 1 and 3 has asynchronous fluctuations of higher SO4 2– and H+ levels compared to other ions. Therefore, we consider whether or not a 380 mm length of the ice core from 587.65 to 588.03 m has seasonal fluctuations in the Na+ and SO4 2– profiles.

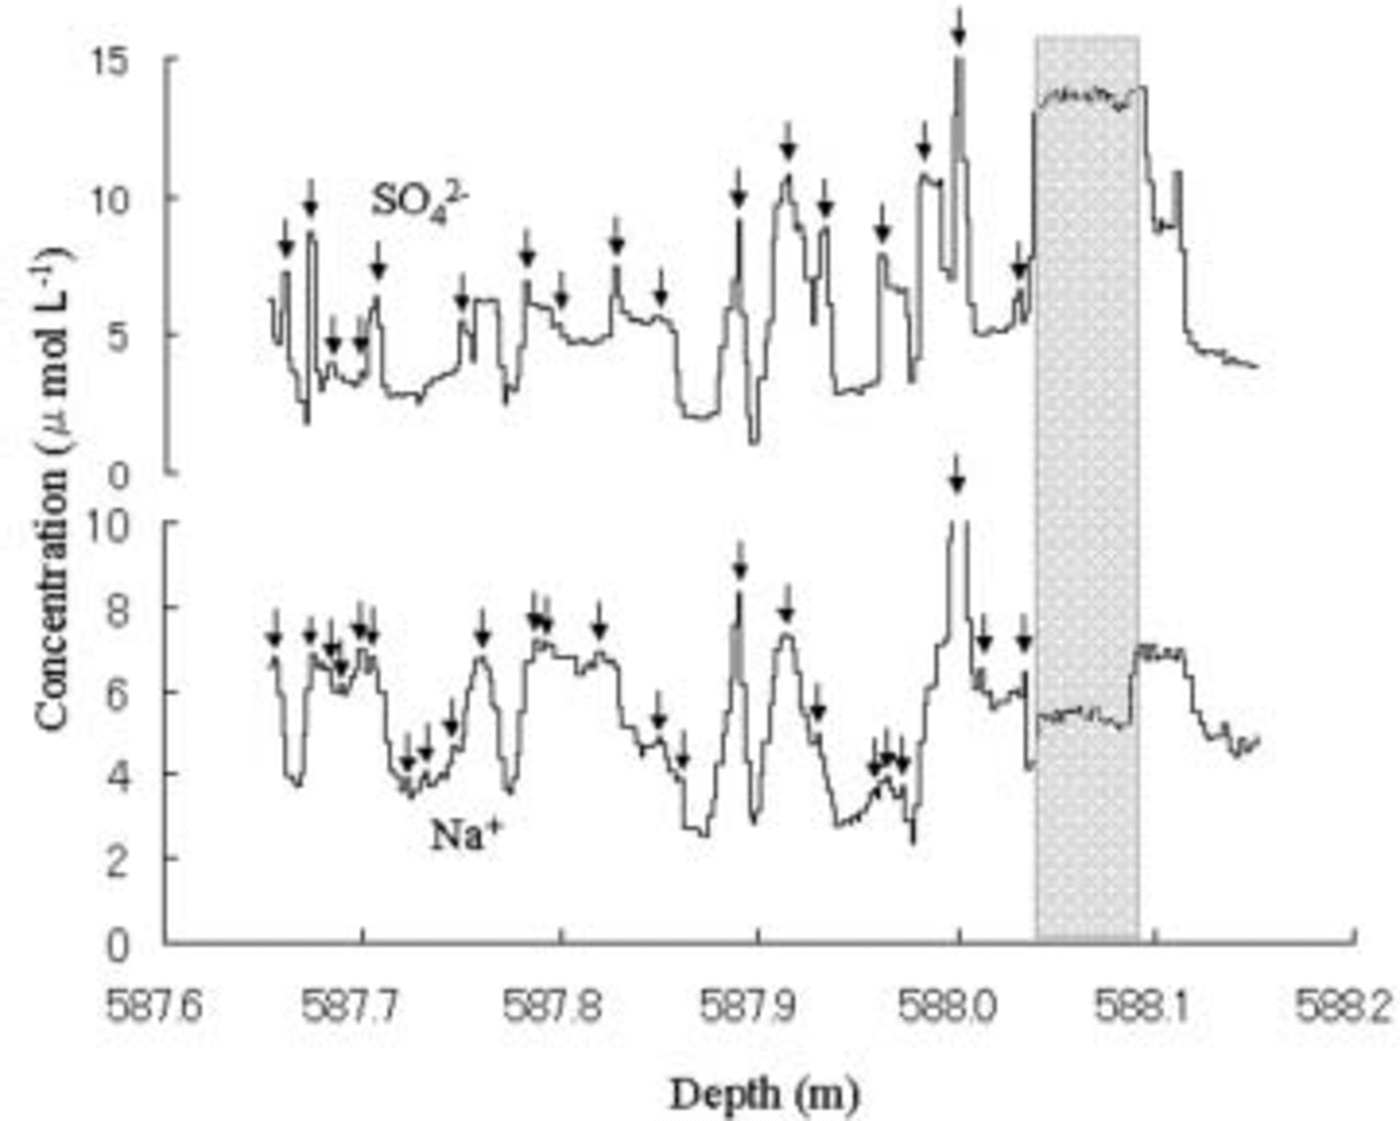
Fig. 3. Vertical distributions of SO4 2– and Na+ of the same ice-core sample as Figure 1. Arrows mark Na+ and SO42– peaks.
The Na+ profile has millimeter- to centimeter-scale fluctuations over the 380 mm length of the ice core (Fig. 3). Na+ concentration in the 380mm length is an average of 5.46 μmol L–1, with an estimated error of <3%. Because the 3% is equal to 0.16 μmol L–1 for Na+, we counted Na+ peaks in the 380mm length that were at least 0.16 μmol L–1 larger than those in neighbor minimal concentrations. The 380mm length has 24 Na+ peaks as the arrows shown in Figure 3. The average width between two peaks in the 380 mm length is 15.8 mm, which coincides with the annual accumulation thickness of 15– 16mm in the entire section of the ice-core samples. This coincidence suggests that the Na+ concentration may retain its seasonal signal.
The widths between two peaks vary widely. The standard deviation of the widths is 8.9 mm. Observation of snow accumulation using 36 stakes at Dome Fuji in 1995 (Reference AzumaAzuma and others, 1997), 1996 (Reference Fujita, Kawada and FujiiFujita and others, 1998) and 1997 (Reference Motoyama, Kawamura, Kanao, Hirasawa, Kaneto and YamanouchiMotoyama and others, 1999) showed the average values and standard deviations as 88 ± 36mm in snow for 1995, 95 ± 43mm for 1996, and 69 ± 67mm for 1997, respectively. These standard deviations correspond to 6.3, 7.5 and 15.3 mm respectively for the same average value of 15.8 mm as average width between two peaks in the 380mm length core. The 8.9 mm standard deviation of the widths in the 380mm length core is well in harmony with these standard deviations of snow accumulation rate in surface snow at Dome Fuji during 1995–97. This harmony suggests that the Na+ concentration may retain its seasonal signal.
The SO4 2– profile has millimeter- to centimeter-scale fluctuations over the 380mm length of the ice core (Fig. 3). The 380 mm length has 17 SO4 2– peaks, shown by arrows in Figure 3, by counting in the same manner as for Na+ peaks. The average width between two peaks in the 380 mm length is 22.2 mm, which does not coincide with the annual accumulation thickness. The shortage of SO4 2– peaks may be due to the diffusion. This is consistent with the analysis on a Dome C ice core by Reference Barnes, Wolff, Mader, Udisti, Castellano and RöthlisbergerBarnes and others (2003) reporting that Na+ does not diffuse. These results suggest that the Na+ concentration in the Dome Fuji ice core may retain its seasonal signal.
Concluding Remarks
We examined anions and cations in an ice-core sample from 587.65 to 588.18m depth of the Dome Fuji ice core and found the following. Cl– and Na+ coexisted with a correlation coefficient of 0.83, suggesting that they originate as sea salt and deposit as precipitation on the ice sheet. Ca2+ and NO3 – coexisted, likely due to reactions of NO3 – with dust. SO4 2– and Ca2+ (Mg2+) coexisted, probably due to anion– cation trapping in snow or ice. Finally, Na+ in the ice core may retain seasonal signals because Na+ has negligible diffusion in ice.
Acknowledgements
We thank the Dome Fuji drilling team and all the participants in the JARE Dome Fuji traverse. We are grateful to S. Fujita and M. Igarashi for providing useful comments. We are also greatly indebted to K. Kreutz, an anonymous referee and the scientific editor V. Maggi for valuable comments. This study was supported by Grants-in-Aid for Creative Scientific Research, grant No. 14GS0202, for Scientific Research (S), grant No. 15101001, and for Scientific Research (B), grant No. 16710012.


