Introduction
Ice cores extracted from ice sheets and glaciers preserve records of past volcanism in local and remote areas (e.g. Reference Hammer, Clausen and DansgaardHammer and others, 1980). An explosive volcanic eruption produces an eruptive column, which reaches altitudes higher than 10 km, and injects huge amounts of volcanic ash and gas (mainly H2O, CO2, SO2, H2S, HCl and HF) into the stratosphere. of the volcanic materials, sulfur gases (SO2 and H2S) are oxidized to form sulfuric acid (H2SO4) aerosols in the stratosphere. These aerosols are suspended in the stratosphere for a few years after eruptions and are spread globally by atmospheric circulation. Reaching polar regions, they are eventually deposited onto the ice-sheet surface by both dry-fallout and washout processes.
Marine biogenic and anthropogenic H2SO4 are also deposited on the ice sheet. the marine biogenic non-sea salt sulfate (nssSO4 2–) concentration of snowfall seasonally changes due to high production of the biogenic H2SO4 in summer (e.g. Reference OsadaOsada, 1994).The anthropogenic nssSO4 2– concentration in the Arctic ice cores increases from the mid-19th century onwards due to an increase in sulfur compounds produced by combustion of solid and liquid fossil fuels in industrialized regions (e.g. Reference Mayewski, Lyons, Spencer, Twickler and WhitlowMayewski and others, 1990). on the other hand, deposition of the anthropogenic H2SO4 is negligible in the Antarctic region because of the long distance from the sources in the Northern Hemisphere. Detection of the volcanic nssSO4 2– concentration peaks (i.e. volcanic signal) requires estimation of non-volcanic nssSO4 2– concentrations corresponding to the biogenic and anthropogenic nssSO4 2– concentration. the non-volcanic nssSO4 2– concentration of the Antarctic and Arctic ice cores is defined as average concentration plus twice the standard deviation (2σ), assuming that the concentration exhibits a Gaussian distribution (Reference Langway, Osada, Clausen, Hammer, Shoji and MitaniLangway and others, 1994; Reference Cole-Dai, Mosley-Thompson and Thompson.Cole-Dai and others, 1997a; Reference RobertsonRobertson and others, 2001).
Up to 100 explosive eruptions with eruptive columns reaching the stratosphere have been recorded during the past 220 years (Reference Simkin and SiebertSimkin and Siebert, 1994). However, less than 20 significant volcanic signals from the past 220 years have been found in Antarctic and Arctic ice cores, respectively (e.g. Reference Hammer, Clausen and DansgaardHammer and others, 1980; Reference Legrand and Delmas.Legrand and Delmas, 1987; Reference Moore, Narita and MaenoMoore and others, 1991; Reference ZielinskiZielinski, 1995; Reference Cole-Dai, Mosley-Thompson and Thompson.Cole-Dai and others, 1997a). This suggests that the volcanic aerosols derived from explosive eruptions are not always found as prominent volcanic signals in the polar ice cores.
In this study, we discuss an appropriate method to identify volcanic signals, and accordingly we detect volcanic signals for the past 220 years in shallow ice cores drilled at Site-J (66˚52’N, 46˚16’W; 2030 ma.s.l.), Greenland, and site H15 (69˚04’ S, 40˚47’ E; 1050ma.s.l.), Antarctica (Fig.1). We have suggested volcanic eruptions as sources of the volcanic signals found in the H15 and Site-J ice cores. Then we identify signals of common source eruptions found in the H15, Site-J and various ice cores and snow samples from the Arctic and Antarctic ice sheets (Fig.1).
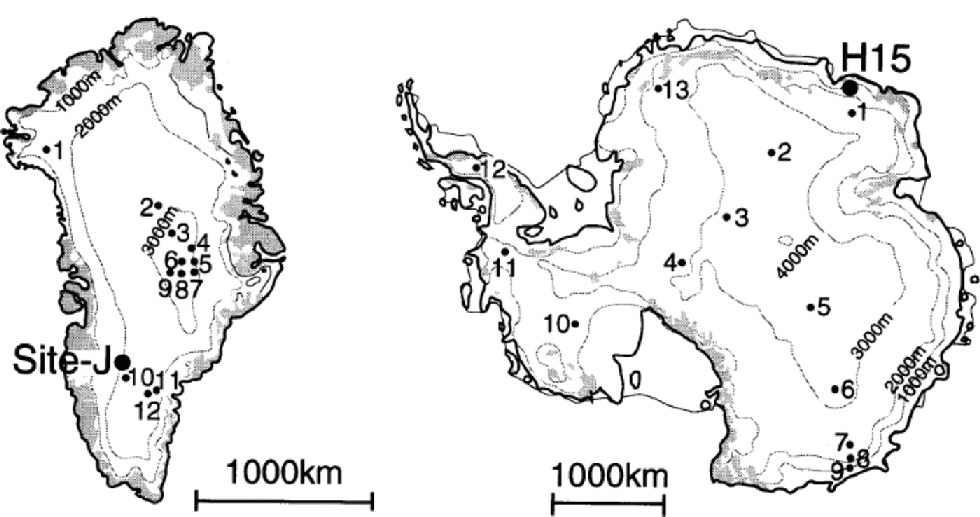
Fig. 1 Location of Site-J ice-core drilling site in Greenland (left) and H15 ice-core drilling site in Antarctica (right). Other drilling sites mentioned in the text are numbered as follows. Greenland: 1. Camp Century; 2. North Central; 3. Summit, Site T; 4. Site E; 5. Site G; 6. Site A;7. Crête;8. Site B; 9. Site D; 10. Dye 2;11. Dye 3;12.20D. Antarctica: 1. G15;2.Dome Fuji; 3. Plateau Remote; 4. South Pole; 5.Vostok; 6. Dome C;7. D80;8. D57; 9. D55;10. Byrd Station; 11. Siple;12. Dyer; 13. Amundsenisen.
Samples and Analytical Procedure
A 120.2 m deep ice core was drilled at site H15, East Antarctica, in 1991 (Reference Fujii, Motoyama and AzumaFujii and others, 1995; Fig. 1). Mean annual air temperature at H15 is –21˚C, and annual snow-accumulation rate is 32 cm a–1w.e. (Reference Kohno, Fukuoka, Fujii and KusakabeKohno and others, 1996). Electrical conductivity measurements (ECM), a measure of acidity, were immediately performed at Syowa station after recovery. the core was cut into 7–10 cm thick slices corresponding to a period of 2–4 months, in a low-temperature room (–20˚C) at the National Institute of Polar Research, Tokyo (Reference Kohno, Fujii, Kusakabe and FukuokaKohno and others, 1999). Surface 5–10mm of the sliced samples were removed with a clean knife in order to eliminate contaminants. Water samples were used for the concentration measurements of major ions (Cl–, NO3 –, SO4 2–, Na+, K+, Mg2+ and Ca2+), pH and oxygen isotopic ratio (δ18O).
A 205.15 m deep ice core was obtained at Site-J, Greenland, in 1989 (Reference Watanabe and FujiiWatanabe and Fujii, 1990; Fig. 1). Mean annual air temperature at Site-J is –20˚C, and annual snow accumulation rate is 42 cm a–1 ice equivalent (Reference Shoji, Clausen and KamedaShoji and others, 1991). the core was cut into 10 cm thick slices, which cover a period of 3 months, in a trench at the drilling site. the sliced samples were melted in Teflon containers in a microwave oven, after removal of the outer 5 mm part with a clean knife. Melted samples were used for in situ measurement of the electrical conductivity (EC) and for laboratory analyses of the δ18O and micro-particle concentration. the water samples having high EC value were used for measurement of major-chemical composition and pH. Pooled samples for measurements of major chemical composition, pH and δ18O were made from 10 successive samples, i.e. 100 cm long samples. Consequently, each pooled sample covers a period of 2 years.
Major-chemical compositions were measured by ion chromatography using a Dionex ion chromatograph (model 2000i) equipped with HIPC-AG4A and CG3 concentrators, AS4 and CS3 separator columns and anion and cation micro-membrane suppressors. Replicate measurements of standard solutions prepared from analytical grade reagents (NaCl, NaNO3, K2SO4 and KCl, Mg2+ and Ca2+ 1000 ppm standard solutions) indicate that the relative analytical error is within 5% of the measured value. In this work, we only mention SO4 2– and Na+ concentrations in order to obtain nssSO4 2– concentration, which is calculated by subtracting the SO4 2– contribution of sea water from the total SO4 2– concentration, assuming that Na+ originates entirely from sea salt:

where (SO4 2–)meas. and (Na+)meas. are the measured SO4 2– and Na+ concentrations of the ice-core samples. (SO4 2–/ Na+)seawater, the ratio of SO4 2– to Na+ concentrations of sea water, was 0.25 in units of weight.
Acidity, which is an index of acidic aerosols deposited in the snow, was measured by a pH meter (HM-60S, TOA Electronics Ltd.). the δ18O of samples was measured with a mass spectrometer (MAT-252) using H2O–CO2 exchange technique, and given by the conventional δ18O expression with respect to Standard Mean Ocean Water.
Dating of Ice Cores
The H15 core is dated by two independent methods: an empirical model of firn densification proposed by Reference Herron and LangwayHerron and Langway (1980), and counting the number of ECM peaks due to high acidity of snow mainly from annual cycles of atmospheric nssSO4 2– concentration (Reference FujiiFujii,1983; Reference Hammer, Clausen and TauberHammer and others, 1986; Reference SteffensenSteffensen, 1988).
The atmospheric nssSO4 2– concentration is governed by production of marine biogenic dimethyl sulfide (DMS) and oxidation of the DMS to H2SO4 via SO2 (Reference Ayers and GilletAyers and others, 1991). the production rate of the DMS increases in summer, and it is oxidized within 1day (Reference Koga and TanakaKoga and Tanaka, 1996). the acidity of snow is consequently high in summer precipitation. the nssSO4 2– concentration and acidity of drifting snow collected at Mizuho station, at a distance of 220km from site H15, are significantly increased in summer precipitation (Reference OsadaOsada, 1994). Therefore, the counts of the ECM and/or nssSO4 2– concentration peaks are used for dating the H15 core. Figure 2 compares the ECM and nssSO4 2– concentration profiles of the surface 4 m deep layer of the H15 core with the dates of the firn given by stake observations continuously performed at least once a year between January 1980 and October 1991 by the Japanese Antarctic Research Expedition (JARE Data Reports, 1981–92). the ECM and nssSO4 2– concentration peaks are assigned to summer layers of appropriate years determined by the stake observations. These peaks were correlated to the summer layers in all but a few cases. An extremely high nssSO4 2– concentration peak at 2.5m depth corresponding to the latter half of 1983 is likely to be related to the sulfuric acid aerosol derived from an explosive volcanic eruption of El Chichόn, Mexico, in 1982.
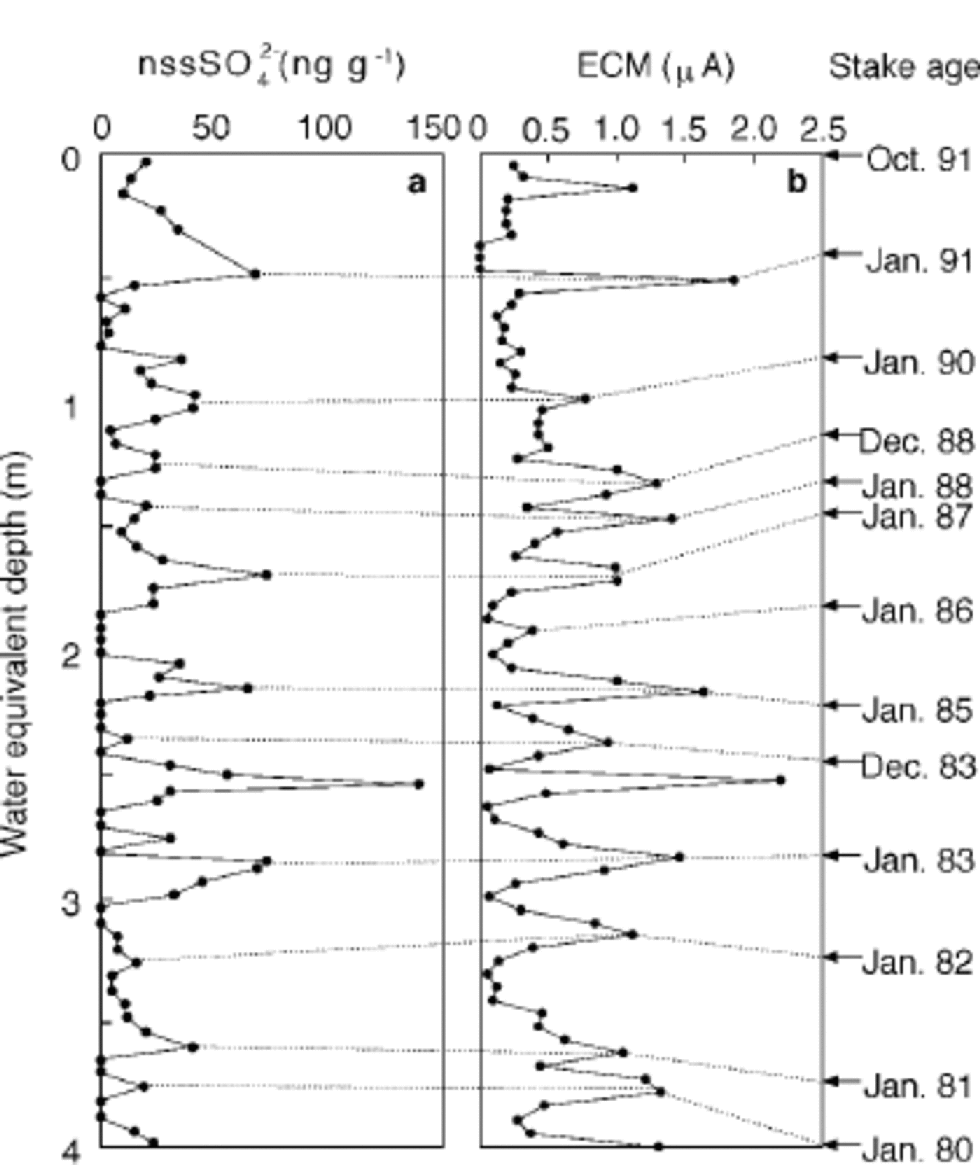
Fig. 2 (a) A profile of nssSO4 2– concentration in firn from H15 as a function of water equivalent depth. A volcanic signal of El Chichόn in 1982 is found at 2.54 m w.e. depth. (b) A profile of ECM in firn from H15. Stake ages (compiled in Reference Kohno, Fukuoka, Fujii and KusakabeKohno and others, 1996) are given to the right of the diagram (after Reference Kohno, Fujii, Kusakabe and FukuokaKohno and others, 1999, fig. 2). A nssSO4 2– high tends to correspond to a ECM high.
Errors of dating by the counting may increase with depth because of errors due to counting of non-summer peaks such as the volcanic signal at 2.5m depth, or erroneous counting of small summer peaks. for the past 220 years the ages estimated by the ECM counting differ by a maximum of 10 years from the ages calculated by Reference Herron and LangwayHerron and Langway’s (1980) densification model (Reference Kohno, Fujii, Kusakabe and FukuokaKohno and others, 1999).
The Site-J core is precisely dated by Reference FujiiFujii and others (2001) using the following two methods: counting annual cycles of δ18O and detection of reference peaks of atmospheric bomb-produced tritium (3H) content. Three significant peaks of 3H in the depth range 15–23m correspond to the key horizons of 1959, 1963 and 1964 as detected in other ice cores from Greenland (e.g. Reference Koide, Michel, Goldberg, Herron and LangwayKoide and others, 1982). the ages of these three peaks determined by the counted annual δ18O cycles agreed with the ages of the key horizons. Dating errors are estimated to be within 2 years in the deeper part of the core (Reference FujiiFujii and others, 2001).
Volcanic Sulfate Ion Signals
A profile of nssSO4 2– concentration of the H15 core is shown in Figure 3a. In order to determine the amount of volcanic SO4 2– concentration, we estimate the level of non-volcanic SO4 2– (i.e. background nssSO4 2–) corresponding to the marine biogenic SO4 2–. Figure 2 shows that the summer peaks of nssSO4 2– concentration correspond to the background nssSO4 2– concentration, because no explosive eruptions (VEI ≥ 4, mentioned later) occurred in this period, except for the 1982 eruption of El Chichόn, as discussed above. We therefore determine that the background level is equal to the highest peak of nssSO4 2– concentration (72 ng g–1) from 1982 to 1991, assuming that the background level is within this level during the past 220 years. the peaks of nssSO4 2– concentration exceeding this background level, shown by the thick solid line in Figure 3a, are considered to be volcanic signals.
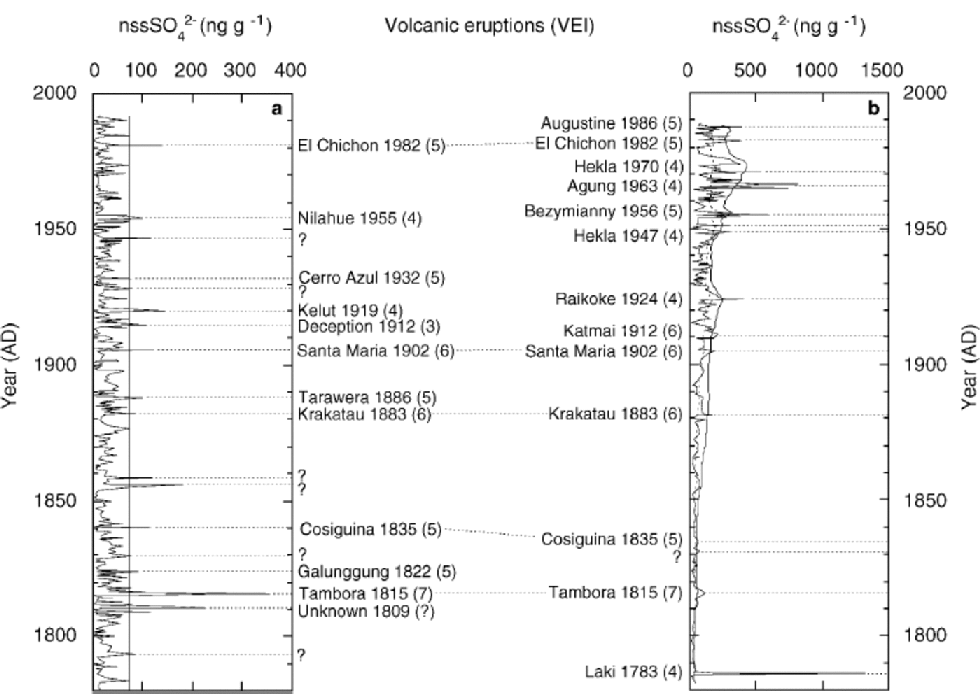
Fig. 3 (a) A profile of nssSO4 2– concentration against water equivalent depth of the H15 core (after Reference Kohno, Fujii, Kusakabe and FukuokaKohno and others, 1999, fig. 5). Thick solid line indicates a background concentration of nssSO4 2– (72 ng g–1). Signals of nssSO4 2– concentration exceeding this background level are shown by dotted line, and the probable source eruptions with VEIs in parentheses are given to the right side of the diagram. (b) A profile of nssSO4 2– concentration against water equivalent depth of the Site-J core. Dashed and solid curves indicate the regression curve of nssSO4 2– concentration and a background level, respectively (see text). Signals of nssSO4 2– concentration exceeding this background are shown by dotted line, and the probable source eruptions with VEIs in parentheses are given to the left side of the diagram. Common volcanic signals among the signals of the H15 and Site-J cores also indicated by dotted line between (a) and (b).
A profile of nssSO4 2– concentration of the Site-J core is shown in Figure 3b. the nssSO4 2– concentration for the Site-J core has increased since 1860, reflecting an increase in the sulfur compound produced by combustion of solid fossil fuel and, since about 1940, liquid fossil fuel (Reference FujiiFujii and others, 2001). the background levels before and after about 1860 correspond mainly to the biogenic and biogenic with anthropogenic SO4 2–, respectively. In contrast to the Antarctic ice cores, the background level of the Arctic cores has changed significantly, and, as the sampling interval of the Site-J core is not constant, we propose the following method for estimating the background level of the Site-J core. Firstly, we smooth the profile of nssSO4 2– concentration using a Stineman function which applies a geometrical weight to each datum (dashed curve in Fig. 3b). Secondly, we calculate the doubled standard deviation (2σ) of the nssSO4 2– concentration in the period (e.g. 1801–08) when no explosive eruptions having VEI ≥ 4 occurred. Then the 2σ values are plotted against age and smoothed using the Stineman function.Thirdly, we superimpose the regression curve of 2σ on that of nssSO4 2– concentration and we define that this curve shown by the thick solid curve in Figure 3b is the background level. Peaks of nssSO4 2– concentration higher than this background level are therefore considered to be volcanic signals.
Signals exceeding the background level in the H15 and Site-J ice cores are assigned to the most plausible eruptions based on the ice-core ages of the volcanic signals, the years of explosive eruptions and the volcanic explosivity index (VEI; Reference Simkin and SiebertSimkin and Siebert, 1994). the VEI proposed by Reference Newhall and SelfNewhall and Self (1982) gives a measure of the power of eruptions, depending on such factors as volume of the erupted magma and the eruption column height. the volume of magmas logarithmically increases with increasing VEI on a scale of 0–8. All known eruptions are given a VEI value (Reference Simkin and SiebertSimkin and Siebert, 1994). the probable source eruptions are also shown in Figure 3a and b, respectively, with year of eruption and their VEIs in parentheses.
Prominent signals of the H15 core are found in two layers at depths of 44 and 46 m, which correspond to AD 1815 and 1810, respectively. Two significant peaks have been found in various cores from both Greenland and Antarctica (e.g. Dye 3 in Greenland and New Byrd in Antarctica: Reference Langway, Osada, Clausen, Hammer and ShojiLangway and others, 1995), whereas the older signal is not found in the Site-J core, probably because of low time resolution. the younger signal is assigned to the eruption of Tambora, Indonesia, in 1815 with a VEI of 7. This assignment is plausible because the eruption is the most explosive during the past 220 years, producing an eruption column to a maximum height of 50 km (Reference Rampino and SelfRampino and Self, 1982; Reference Self, Rampino, Newton and WolffSelf and others, 1984). A 0.7˚C lowering of the mean atmospheric temperature in the Northern Hemisphere has been recorded, which probably triggered ``the year of 1816 without summer’’ (Reference Stommel and StommelStommel and Stommel, 1983). the older signal has not been assigned because there are no records of probable eruptions around this date.
The most significant signal of nssSO4 2– concentration during the past 220 years is found at 81 m depth in the Site-J core, corresponding to AD 1784. We assign the signal to the eruption of Laki, Iceland, in 1783 with a VEI of 4. the signal of the Laki eruption is detected in various cores from the Arctic region (e.g. Summit: Reference ZielinskiZielinski, 1995, Reference ClausenClausen and others, 1997; Camp Century: Reference Clausen and Hammer.Clausen and Hammer, 1988; Mount Logan: Reference MayewskiMayewski and others, 1993). the eruption column height is estimated to range from 6 to 13 km (Reference Thordarson, Self and HulseboeschThordarson and others, 1996).The atmospheric aerosol produced during the eruption was observed over Europe (Reference FiaccoFiacco and others, 1994). Extreme decrease of air temperature, resulting from injection of sulfuric acid aerosols, was recorded in the Northern Hemisphere (Reference SigurðssonSigurðsson,1982). However, this signal is not found in the H15 core, probably because the aerosol from Laki at high northern latitude did not reach the Antarctic region. Among the volcanic signals of the H15 and Site-J cores, five common signals are found, which are indicated by the dotted lines between Figure 3a and b.
Bipolar Volcanic Signals
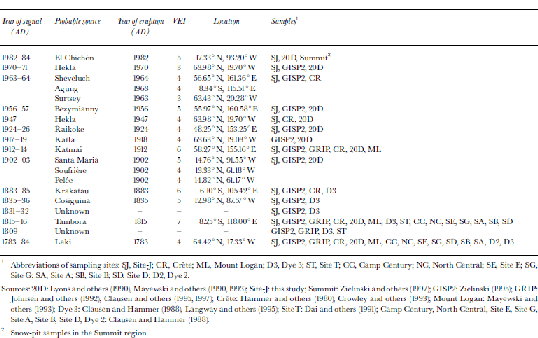
Prominent signals of the nssSO4 2– concentration or ECM during the past 220 years found in the ice cores from H15, Site-J and other locations in Antarctica and the Arctic are listed in Tables 1 and 2, respectively. Also given are their probable source volcanoes, years of their eruptions and VEI values. the sampling locations, except for Mount Logan,Canada, are shown in Figure 1. the age assignment of each signal differs by a few years from core to core because of dating errors and/or variability in the timing of the deposition of the volcanic aerosol onto the ice sheets. on the basis of Tables 1 and 2, common signals found from the ice cores and snow pits of the ice sheets and glaciers in the Antarctic and the Arctic regions during the past 220 years are derived from the eruptions of El Chichόn in 1982, Agung, Indonesia, in 1963, Santa Maria, Guatemala, in 1902, Krakatau, Indonesia, in 1883, Cosiguina, Nicaragua, in 1835, an unknown volcano between 1831 and 1834, Tambora in 1815 and an unknown volcano in 1809.
Table 1. Volcanic signals recorded in ice cores and snow pits in the Antarctic region during past 220 years
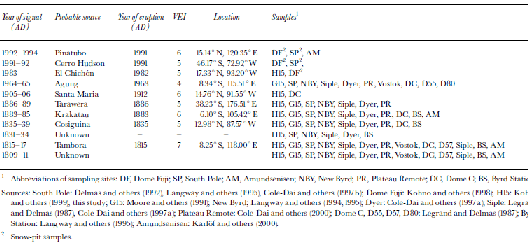
Table 2. Volcanic signals recorded in ice cores and snow pits in the Arctic region
1 Abbreviations of sampling sites: DF, Dome Fuji; SP, South Pole; AM, Amundsenisen; NBY, New Byrd; PR, PlateauRemote;DC, Dome C; BS, Byrd Station.
Sources: South Pole: Reference Delmas, Kirchner, Palais and PetitDelmas and others (1992), Reference Langway, Osada, Clausen, Hammer and ShojiLangway and others (1995), Reference Cole-Dai, Mosley-Thompson and ThompsonCole-Dai and others (1997b); Dome Fuji: Reference Kohno, Kusakabe and FujiiKohno and others (1998); H15: Reference Kohno, Fujii, Kusakabe and FukuokaKohno and others (1999), this study; G15: Reference Moore, Narita and MaenoMoore and others (1991); New Byrd; Reference Langway, Osada, Clausen, Hammer, Shoji and MitaniLangway and others (1994,Reference Langway, Osada, Clausen, Hammer and Shoji1995); Dyer: Reference Cole-Dai, Mosley-Thompson and Thompson.Cole-Dai and others (1997a); Siple: Reference Legrand and Delmas.Legrand and Delmas (1987), Reference Cole-Dai, Mosley-Thompson and Thompson.Cole-Dai and others (1997a); Plateau Remote: Reference Cole-Dai, Mosley-Thompson, Wight and ThompsonCole-Dai and others (2000); Dome C, D55,D57, D80: Reference Legrand and Delmas.Legrand and Delmas (1987); Byrd Station: Reference Langway, Osada, Clausen, Hammer and ShojiLangway and others (1995); Amundsenisen: Reference KarlöfKarlöf and others (2000).
2 Snow-pit samples.
The 1982 eruption of El Chichόn (VEI 5) is one of the most explosive in recent decades. the eruption column is estimated to have reached well into the stratosphere, 32 km high (Reference CareyCarey and Sigurðsson,1986). This column height means that the eruption may have had a global impact. the amount of SO2 injected into the stratosphere is estimated to be 7 Mt SO2 using satellite observation (Reference KruegerKrueger, 1983; Reference Bluth, Schnetzler and WalterBluth and others, 1993). the eruption of Agung in 1963 (VEI 4) with a maximum eruption column height of 28 km (Reference Rampino and SelfRampino and Self, 1982; Reference Self and King.Self and King, 1996). the eruption of Santa Maria in 1902 (VEI 5) with an eruption column height of 28 km (Reference Williams and SelfWilliams and Self,1983). the eruption column of Krakatau (VEI 6) in 1883 rose to at least 26 km high (Reference Mandeville and CareyMandeville and others, 1996). the 1835 eruption of Cosiguina (VEI 5) produced an eruption column 35 km high (Reference Self, Rampino and Carr.Self and others, 1989).
These volcanic eruptions, except for the two unknown eruptions, have two common characteristics: (1) they took place at low latitudes between 20˚N and 10˚ S, and (2) the eruption column heights exceeded 25 km (i.e. eruptions having VEI ≥ 5) except for the Agung eruption having VEI 4.The latter may have been a high-sulfur-release eruption among eruptions having VEI 4. the amount of SO2 emission during this eruption is estimated to be 2.5 Mt SO2 by a petrologic method (Reference Self and King.Self and King, 1996) which commonly provides a minimum estimate (Reference Devine and SelfDevine and others, 1984; Reference Palais, Sigurðsson, Berger and KidsonPalais and Sigurðsson,1989).This emission is comparable to that of eruptions having VEI 5 based on a relation between the SO2 emission and VEI values proposed by Reference Bluth, Schnetzler and WalterBluth and others (1993). Therefore, if the eruptions having VEI 4 take place at low latitudes and are accompanied by sulfur-rich gas, the sulfuric acid aerosol may spread over and be deposited in both polar regions.
1 Abbreviations of sampling sites: SJ, Site-J; CR, Crête; ML, Mount Logan; D3, Dye 3; ST, SiteT; CC, Camp Century; NC, North Central; SE, Site E; SG, Site G; SA, Site A; SB, Site B; SD, Site D; D2, Dye 2.
Sources: 20D: Reference Lyons, Mayewski, Spencer and Graedel.Lyons and others (1990), Reference Mayewski, Lyons, Spencer, Twickler and WhitlowMayewski and others (1990,Reference Mayewski1993); Site-J: this study; Summit: Reference Zielinski, Dibb, Mayewski and Twickler.Zielinski andothers (1997); GISP2: Reference ZielinskiZielinski (1995); GRIP: Reference JohnsenJohnsen and others (1992), Reference Clausen and DelmasClausen and others (1995,Reference Clausen1997); Crête: Reference Hammer, Clausen and DansgaardHammer and others (1980), Reference Crowley and Smith.Crowley and others (1993); Mount Logan: Reference MayewskiMayewski and others (1993); Dye 3: Reference Clausen and Hammer.Clausen and Hammer (1988), Reference Langway, Osada, Clausen, Hammer and ShojiLangway and others (1995); SiteT: Reference Dai and Thompson.Dai and others (1991); Camp Century, North Central, Site E, Site G, Site A, Site B, Site D, Dye 2: Reference Clausen and Hammer.Clausen and Hammer (1988).
2 Snow-pit samples in the Summit region.
The presence of the two common characteristics mentioned above implies that the two unknown eruptions of 1831–34 and 1809 may have taken place at low latitudes, having VEI >5. These characteristics may help to narrow down the source of these unknown eruptions. One unknown signal in the period 1831–34 has been assigned to the 1831eruption of Babuyan, Philippines, by Reference Delmas, Kirchner, Palais and PetitDelmas and others (1992), Reference Langway, Osada, Clausen, Hammer and ShojiLangway and others (1995) and Reference ZielinskiZielinski (1995). Volcanogenic atmospheric phenomena such as red sky, dim sun and temperature decrease, which were recorded in the early 1830s, are attributed to the aerosols of the Babuyan eruption (VEI 4) by Reference Self, Rampino and Carr.Self and others (1989). on the other hand, Reference Cole-Dai, Mosley-Thompson, Wight and ThompsonCole-Dai and others (2000) doubt the assignment because the unknown peaks found in the ice cores from Siple and Dyer in West Antarctica are separated by 2 years, suggesting that the signals do not derive from any global events. Another unknown signal in 1809–11 has been precisely resolved by Reference Dai and Thompson.Dai and others (1991). They mentioned that the signal originates from an eruption occurring in the Equatorial region in 1809, and the SO2 emission corresponds to half of that from the Tambora eruption in 1815. No eruptions with VEI >5 were recorded during that time (Reference Simkin and SiebertSimkin and Siebert, 1994), and Reference Palais, Kirchner and Delmas.Palais and others (1990) find micrometer-sized andesitic glasses in the 1809 layer of the ice core from South Pole. Reference Self, Rampino and Carr.Self and others (1989) regard the moderate eruption of Cosiguina in 1809 as a possible source of the unknown signal.
Conclusions
Common volcanic signals found in both polar ice sheets during the past 220 years are derived from the eruptions of El Chichόn in 1982, Agung in 1963, Santa Maria in 1902, Krakatau in 1883, Cosiguina in 1835, an unknown volcano between 1831and 1834,Tambora in 1815 and an unknown volcano in 1809. Volcanic eruptions potentially able to produce volcanic signals in bipolar ice sheets are characterized as follows: (1) the eruptions take place in low latitudes between 20˚N and 10˚S, and (2) the eruption column height reaches >25 km, mainly in the case of eruptions having VEI >5.
Acknowledgements
We sincerely thank reviewers for their valuable and beneficial comments and suggestions. We also thank T. Tominaga and T. Kobayash. of the National Institute of Polar Research for their help with chemical analyses of ice-core samples.


